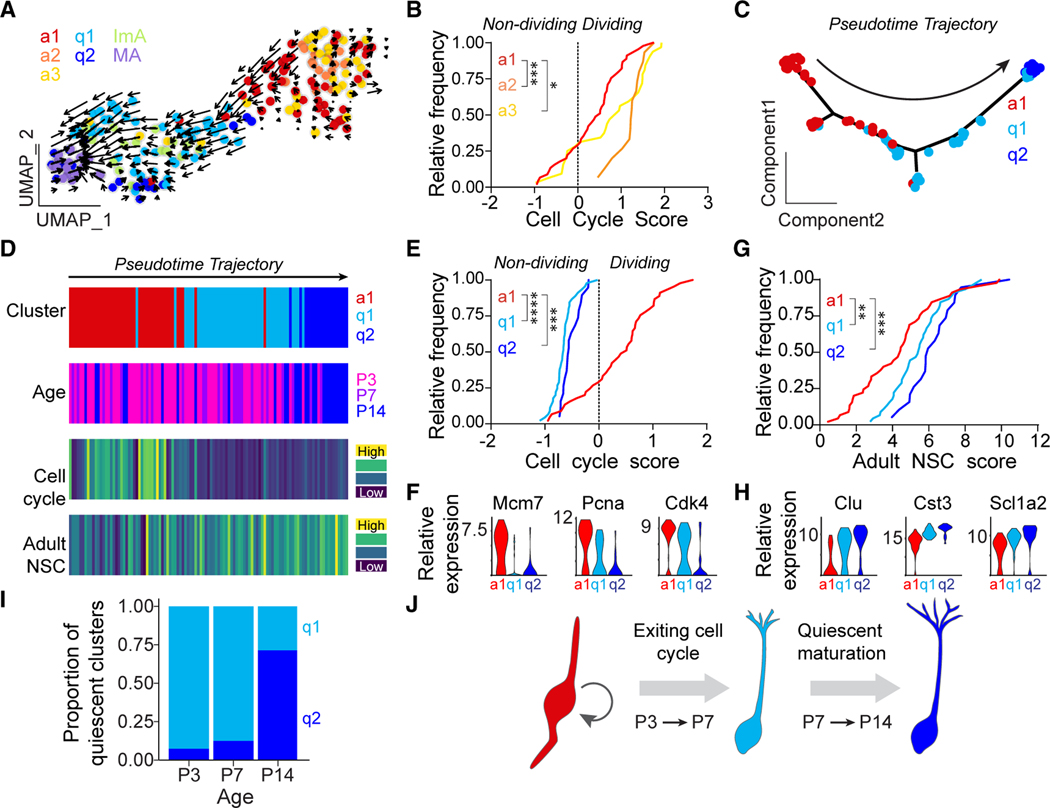
Figure 2. NSCs exit cell cycle and undergo additional maturation before reaching an adult state.
(A) RNA velocity vectors overlaid on the cluster UMAP (Figure 1E).
(B) Distribution curve of cell cycle scores for individual cells of all three active clusters (a1, a2, and a3; *p < 0.05, ***p < 0.001; Kruskal-Wallis rank-sum test with Dunn’s post hoc test).
(C) Principal component analysis (PCA) showing the pseudotime trajectory of cells from clusters a1, q1, and q2 that represents the NSC transition to a quiescent adult state. Arrow indicates direction of pseudotime trajectory.
(D) Heatmaps of cell cycle scores and adult NSC scores of individual cells in pseudotime order with the corresponding cluster and age identification. Cell cycle score was calculated as in (B).
(E) Distribution curve of cell cycle scores for individual cells from clusters a1, q1, and q2 (***p < 0.001, ****p < 0.0001; Kruskal-Wallis rank-sum test with Dunn’s post hoc test).
(F) Violin plots of sample cell cycle gene expression for clusters a1, q1, and q2.
(G) Distribution curve of adult NSC scores for individual cells from clusters a1, q1, and q2 (**p < 0.01, ***p < 0.001; Kruskal-Wallis rank-sum test with Dunn’s post hoc test).
(H) Violin plots of sample adult NSC gene expression for clusters a1, q1, and q2.
(I) Bar plot of the proportion of cells in quiescent NSC clusters (q1 and q2) at each age.
(J) Graphical summary showing that DG NSCs first exit cell cycle between P3 to P7 and then acquire a more mature transcriptomic signature from P7 to P14.

