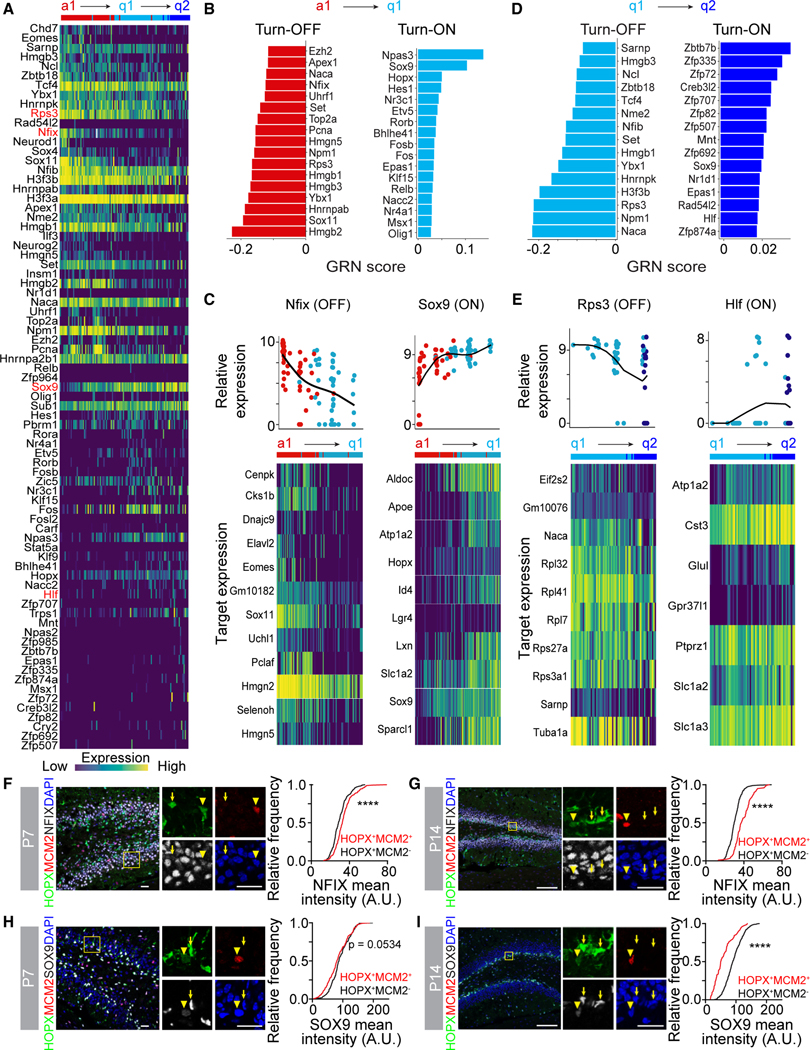
Figure 3. Distinct gene regulatory network activity at each step of NSC development.
(A) Heatmap of transcriptional regulator gene expression across the pseudotime trajectory (Figure 2D) identified by GRN analysis. Transcriptional regulators highlighted in red are plotted in (C) and (E), along with their target gene expression.
(B) Bar plot of regulon GRN scores whose activity turned off (left panel) or turned on (right panel) across the a1 to q1 step of the pseudotime trajectory.
(C) Dot plot of transcriptional regulator gene expression across the a1 to q1 step of the pseudotime (Nfix and Sox9, upper panels) and heatmap of corresponding target gene expression (lower panels).
(D) Bar plot of regulon GRN scores whose activity turned off (left panel) or turned on (right panel) across the q1 to q2 step of the pseudotime trajectory.
(E) Dot plot of transcriptional regulator gene expression across the q1 to q2 step of the pseudotime (Rps3 and Hlf, upper panels) and heatmap of corresponding target gene expression (lower panels).
(F–I) Sample confocal images of NFIX (F and G) or SOX9 (H and I) expression in HOPX+ NSCs by immunostaining at P7 (F and H) or P14 (G and I) in the DG (left panels). Boxed area is shown at higher magnification (middle panels; arrowheads = dividing [HOPX+MCM2+] NSCs, arrows = quiescent [HOPX+MCM2−] NSCs). Scale bars: 20 μm. Cumulative frequency distribution plots of NFIX or SOX9 mean intensity (right panels) in dividing NSCs (red line) and quiescent NSCs (black line). (n > 300 cells from 3 mice; ****p < 0.0001; Kolmogorov-Smirnov test).

