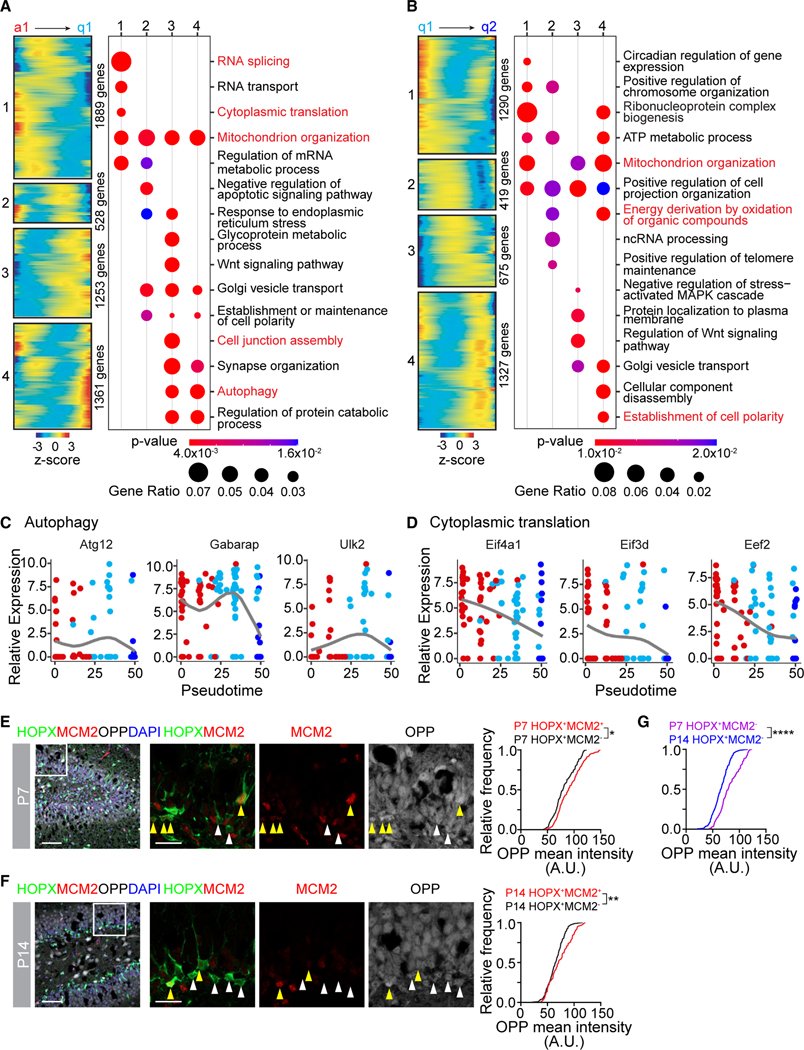
Figure 4. Cell biology changes at each step of NSC development.
(A) Heatmaps of gene expression patterns (#1, 2, 3, and 4) across the a1 to q1 step of the pseudotime (left panel) and bubble plots of Gene Ontology (GO) analysis of biological processes analysis of each pattern (right panel). Genes from GO terms in red are plotted in (C) and (D) and Figure S4A.
(B) Heatmaps of gene expression patterns (#1, 2, 3, and 4) across the q1 to q2 step of the pseudotime (left panel) and bubble plots of GO analysis of biological processes analysis of each pattern (right panel). Genes from GO terms in red are plotted in Figure S4B.
(C) Dot plot of autophagy-related gene expression across the pseudotime.
(D) Dot plot of cytoplasmic translation-related gene expression across the pseudotime.
(E and F) Sample confocal images of OPP (O-propargyl-puromycin) staining in dividing (HOPX+MCM2+) and quiescent (HOPX+MCM2−) NSCs at P7 (E) or P14 (F) (left panel). Boxed area is shown at higher magnification (middle panels; yellow arrowheads = dividing [HOPX+MCM2+] NSCs, white arrowheads = quiescent [HOPX+MCM2−] NSCs). Scale bars: 50 μm (left panels) and 20 μm (middle panels). Cumulative frequency distribution plots of OPP mean intensity (right panel) in dividing NSCs (red line) and quiescent NSCs (black line). (n > 300 cells; *p < 0.05; **p < 0.01; Kolmogorov-Smirnov test).
(G) Cumulative frequency distribution plot of OPP mean intensity in quiescent (HOPX+MCM2−) NSCs at P7 (purple line) and P14 (blue line). Same data in (E) and (F) are replotted (****p < 0.0001; Kolmogorov-Smirnov test).

