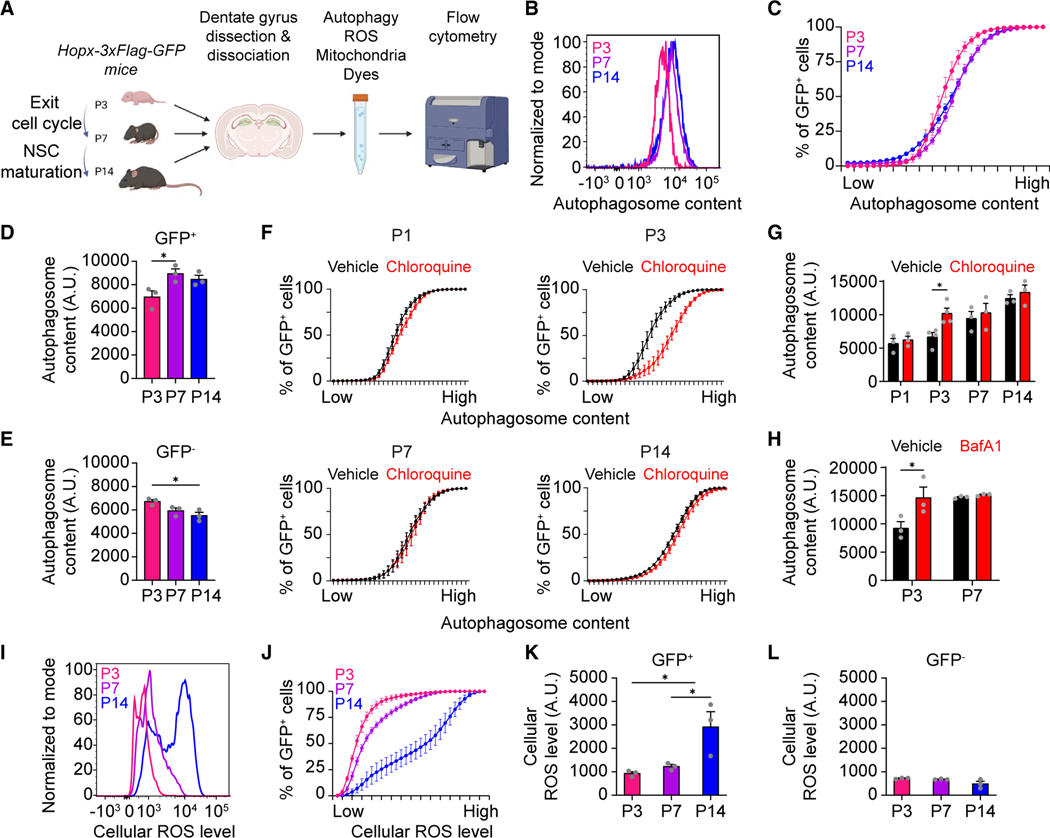
Figure 5. Targeted metabolic analysis reveals distinct changes in autophagy and ROS in NSCs during the transition to a quiescent adult state.
(A) Diagram of metabolic analysis workflow. DG cells were isolated from Hopx-3xFlag-GFP mice at P3, P7, and P14 and loaded with dyes to measure autophagic vesicle content, cellular reactive oxygen species (ROS), and mitochondrial mass in via flow cytometry.
(B–E) Flow cytometry analysis of autophagic vesicle content in GFP+ cells (B–D) and GFP− cells (E) using Autophagy Assay Kit (Red) shown as a histogram plot of individual samples (B), a cumulative distribution plot of all samples (C), and a bar plot of the average of all samples (D and E; individual dots represent data from each experiment). Values represent mean ± SEM (n = 3 experiments; 3 mice were pooled for each experimental sample; *p < 0.05; one-way ANOVA with Tukey’s post hoc test).
(F and G) Flow cytometry analysis of autophagic vesicle content in GFP+ cells after vehicle or chloroquine (10 μM) treatment shown as a cumulative distribution plot of all samples (F) and as a bar plot of the average of all samples (G). Values represent mean ± SEM (n = 3 experiments; 3 mice were pooled for each experimental sample; *p < 0.05; two-way ANOVA with Šídák’s multiple comparisons test).
(H) Bar plot of flow cytometry analysis of autophagic vesicle content in GFP+ cells after vehicle or bafilomycin A (BafA1; 10 nM) treatment. Values represent mean ± SEM (n = 3 experiments; 3 mice were pooled for each experimental sample; *p < 0.05; two-way ANOVA with Šídák’s multiple comparisons test).
(I–L) Flow cytometry analysis of cellular ROS levels in GFP+ cells (I–K) and GFP− cells (L) using dihydroethidium (DHE). Similar as in (B)–(E). Values represent mean ± SEM (n = 3 experiments; 3 mice were pooled for each experimental sample; *p < 0.05; one-way ANOVA with Tukey’s post hoc test).
Also see Figure S5.

