Fig. 4.
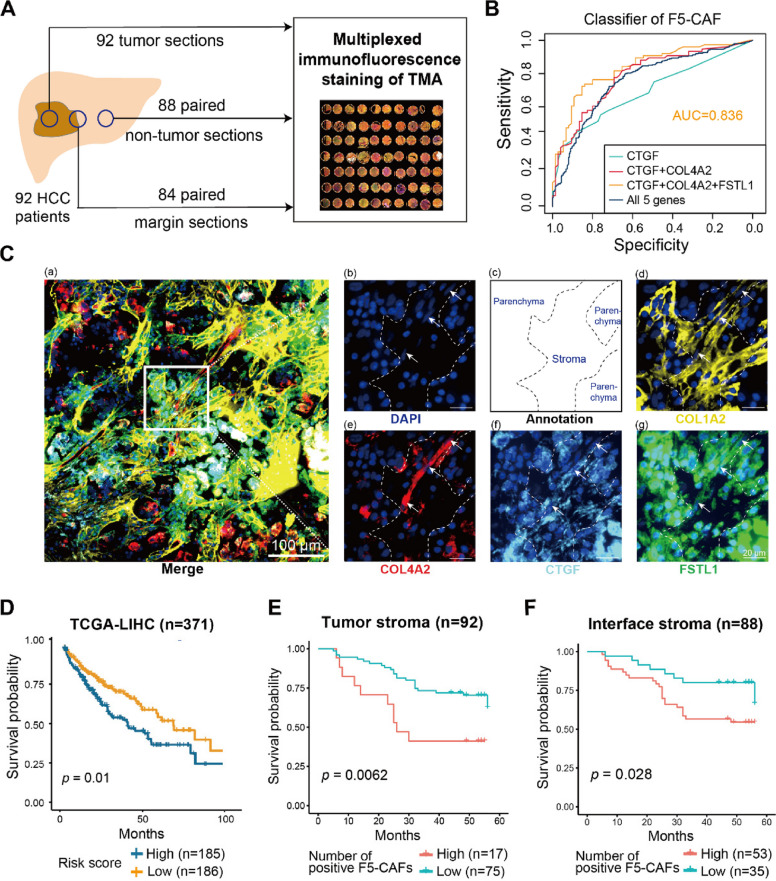
F5-CAFs in HCC patients were associated with an unfavorable prognosis. A The experimental workflow of multiplexed immunofluorescence (mIF) staining of a hepatocellular carcinoma (HCC) tissue microarray (TMA). B Receiver operating characteristic curves of gene combinations predicted by the random forest model. AUC, area under the curve. C Representative composite image of the tumor core tissue by using mIF staining (COL1A2, yellow; COL4A2, red; CTGF, blue; FSTL1, green; and DAPI, dark blue). a, merged image; b, an enlarged subsection of the core highlighted in (a), colored by DAPI nuclear marker with arrows indicating F5-CAF; c, an annotated drawing of the location of parenchymal and stromal tissues; d–g, showing each of the individual markers, together with the DAPI nuclear marker and the autofluorescence signal (pseudocolored black). The spindle cells indicated by the white arrows are fibroblasts that are positive for all five markers. D Overall survival of patients in the TCGA cohort based on the risk score, defined by the expression of F5-CAF markers, stratified by the median value. E Overall survival analysis of HCC patients with a high or low number of F5-CAFs in the tumor stroma, stratified by the best cutoff value. F Overall survival analysis of HCC patients with a high or low number of F5-CAFs in the interface stroma, stratified by the best cutoff value. See also Fig. S4

