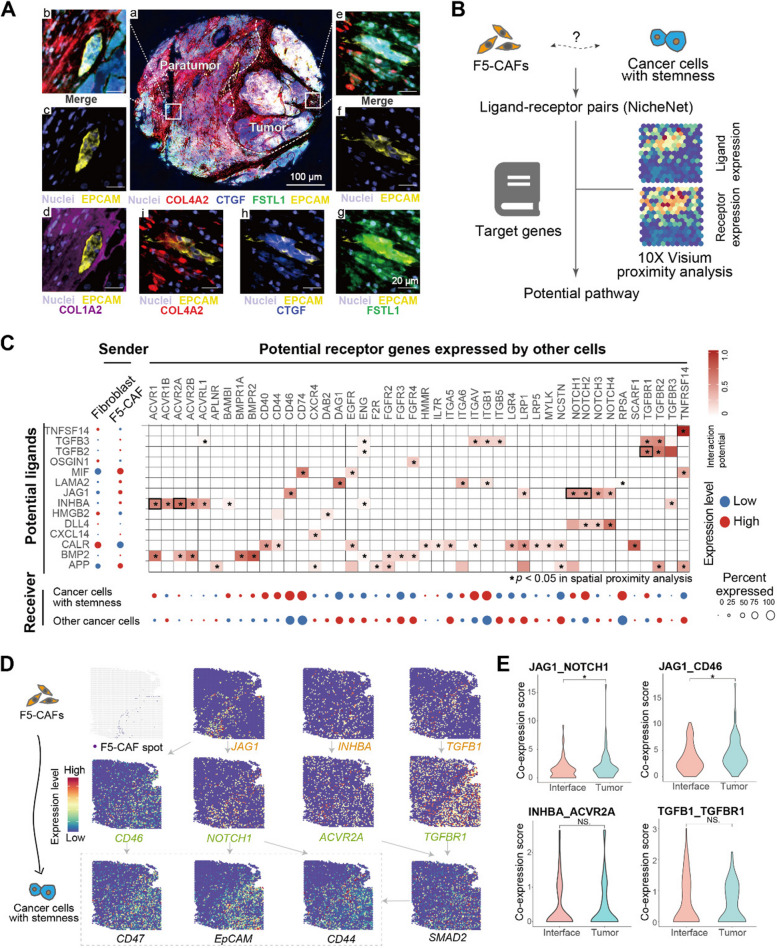
Fig. 6.
Cellular crosstalk between F5-CAFs and HCC CSCs. A Representative composite mIF image of the HCC interface area (EPCAM, yellow; COL4A2, red; CTGF, blue; FSTL1, green; COL1A2, purple and DAPI, weak purple). a, merged image. The dashed curve indicates the boundary of the tumor tissue. b–i, enlarged subsection highlighted in the non-tumor area (b–d) or in the tumor area (e–i) as in (a), showing five merged markers (b, e) or the individual marker(s) in the composite image after spectral unmixing, together with the nuclear marker DAPI (pseudocolored purple) and the autofluorescence signal (pseudocolored black). B Schematic of F5-CAF ligand‒receptor (L–R) analysis in the TME. C Left, average expression of the top ligands predicted by NicheNet across F5-CAFs and other fibroblast subpopulations modulating cancer cells. Middle, heatmap of significant L-R pairs in ST. The black box marks the pathway shown in D. Bottom, average expression of ligand-matched receptors expressed by malignant spots. D Spatial feature plots (ST2 sample) of select ligands expressed by F5-CAFs and cognate receptor expression by cancer cells with stemness. E L–R co-expression scores at different locations. *, p < 0.05 and NS, p > 0.05 by Wilcoxon rank-sum test. See also Fig. S6

