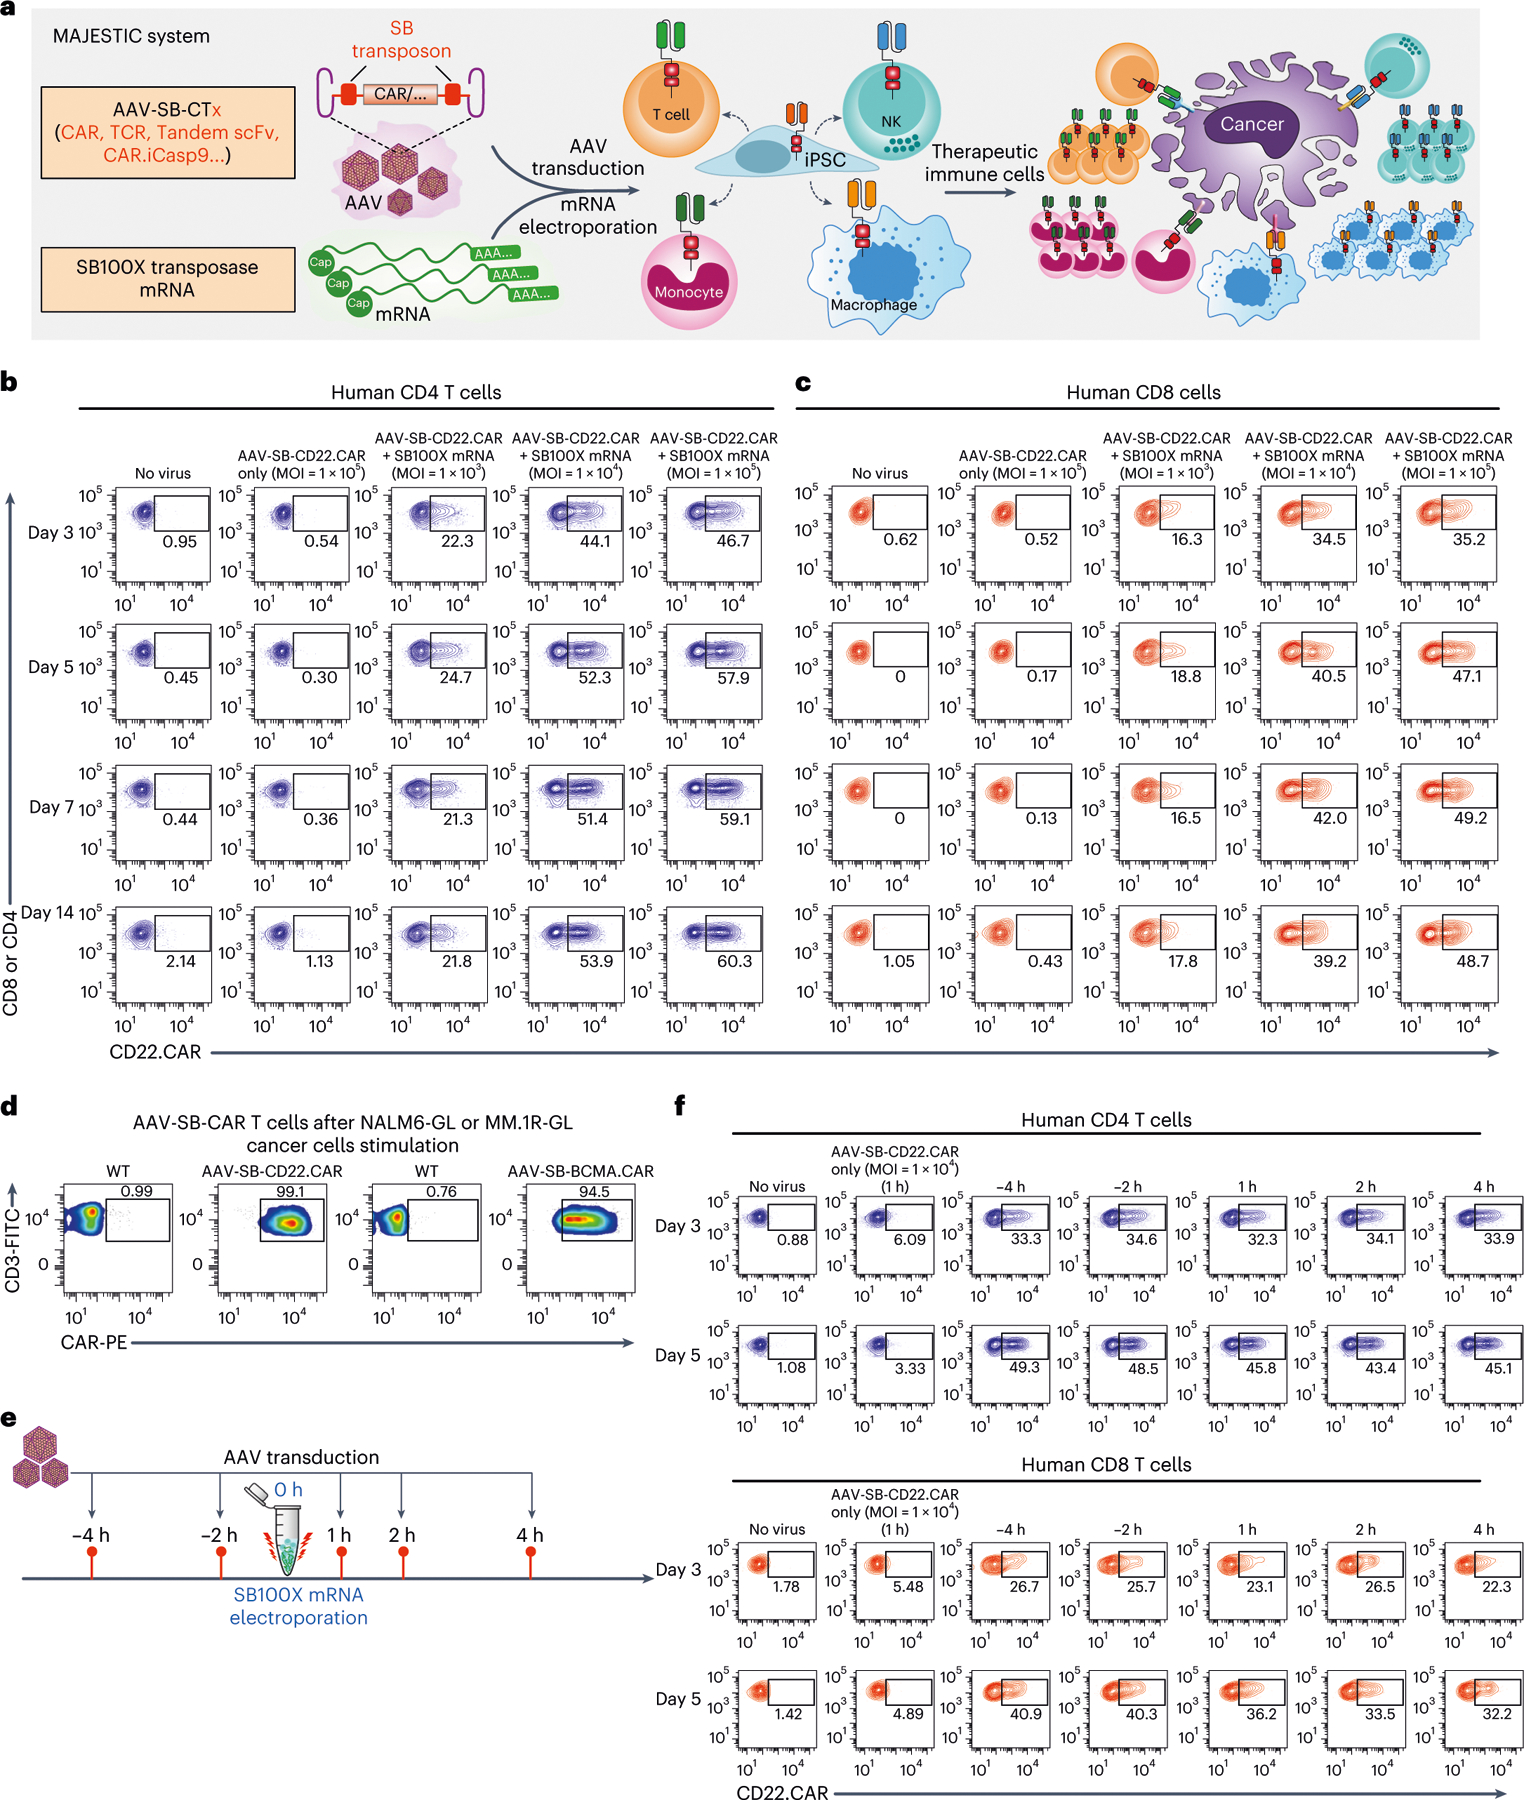
Fig. 1 |. Development of MAJESTIC, a composite mRNA:AAV-SB system for highly efficient generation of therapeutic immune cells.

a, Schematics of the hybrid AAV-SB construct, SB100X mRNA electroporation and CAR T/NK/macrophage/iPSC generation. b, Representative flow cytometry plots of human CD4 (gated for CD3+CD8−cells) AAV-SB-CD22.CAR T cells. Human CD3 T cells were first electroporated with SB100X mRNA, then transduced with a titration series of AAV-SB-CD22.CAR virus. CAR expression levels were evaluated at various time points from day 3 to day 14. c, Representative flow cytometry plots of human CD8 (gated for CD3+CD8+ cells) AAV-SB-CD22.CAR T cells. Human CD3 T cells were first electroporated with SB100X mRNA, then transduced with a titration series of AAV-SB-CD22.CAR virus. Data were collected at several time points from day 3 to day 14. d, Representative flow cytometry plots of AAV-SB-CD22.CAR and AAV-SB-BCMA.CAR T cells after cancer stimulation. e, Schematic representation of various AAV-SB-CD22.CAR transduction time points relative to SB100X mRNA electroporation. f, Representative flow cytometry plots of CD22.CAR T cells quantifying CAR-percentages of CD4 (top) and CD8 (bottom) T cells which were transduced with AAV-SB-CD22.CAR virus at various time points relative to when SB100X mRNA electroporation occurred (at 0 h). In this figure, for optimization of conditions, each assay was done with one donor with three technical replicates. Donor 2 T cells were used in this figure. Cells were not purified for CD8/CD4 populations before electroporation.
