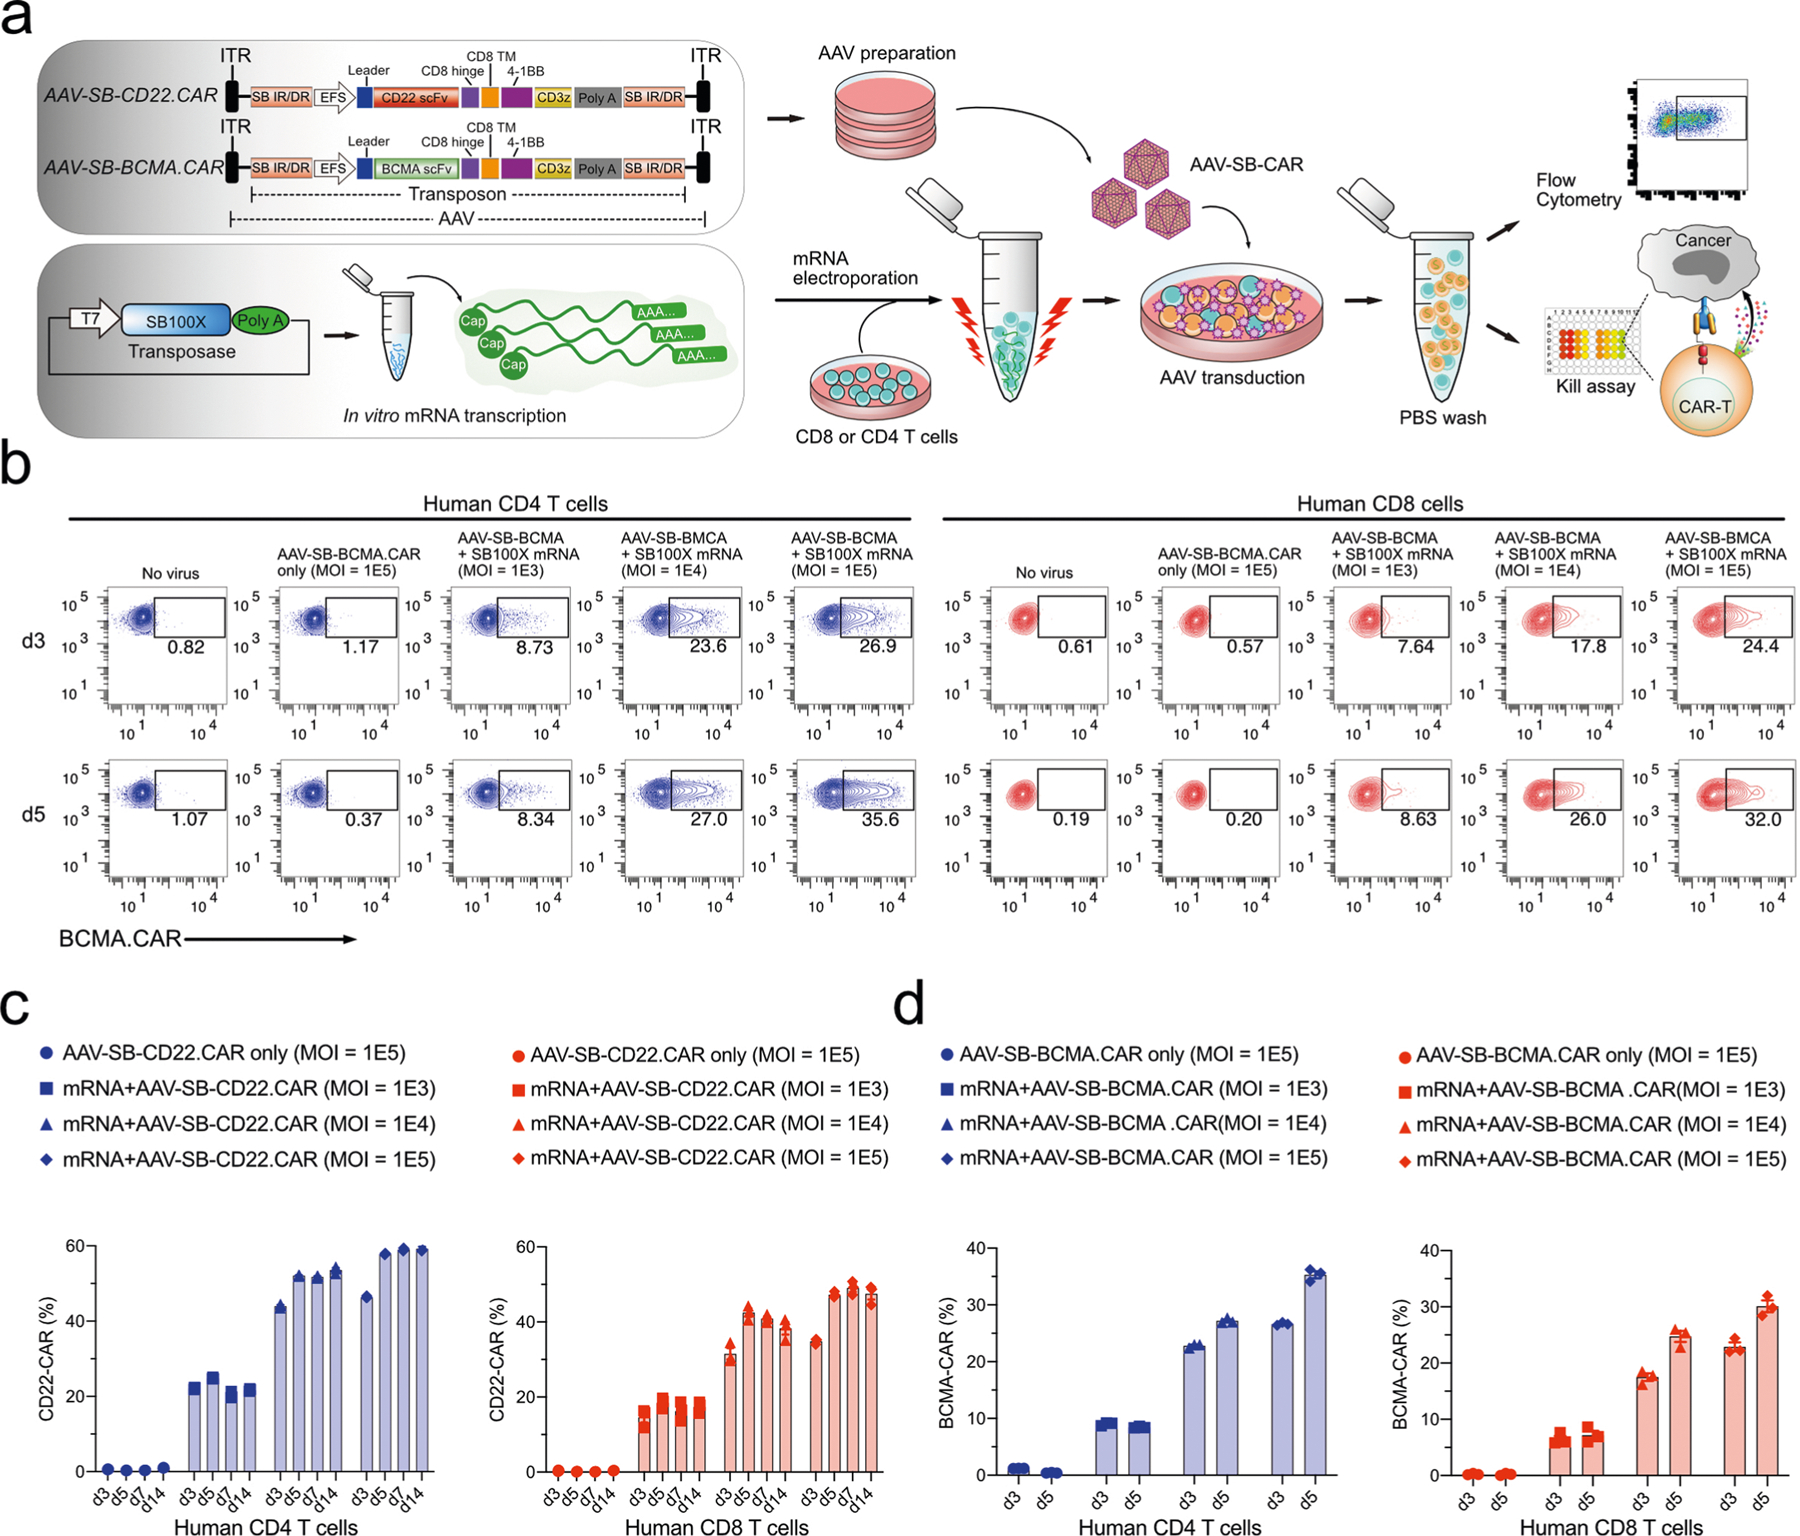
Extended Data Fig. 1 |. MAJESTIC CAR generation and optimization.

a, Schematic of AAV-SB-CD22.CAR, AAV-SB-BCMA.CAR, and SB100X constructs and key procedures: mRNA in vitro transcription, AAV production, mRNA electroporation, flow cytometry, and kill assay. b, Representative flow cytometry plots of AAV-SB-BCMA.CAR CD4 (left) and CD8 (right) T cells show the percentage of CAR-expressing cells. CD4 cells are defined as CD3+ and CD8− cells. c, Quantification of CD22.CAR T cell ratio of (Fig. 1b, c). d, Quantification of BCMA.CAR T ratio in human CD4 and CD8 T cells. In this figure, for optimization of conditions, each assay was done with one donor with three technical replicates. Donor 2 T cells were used in this figure.
