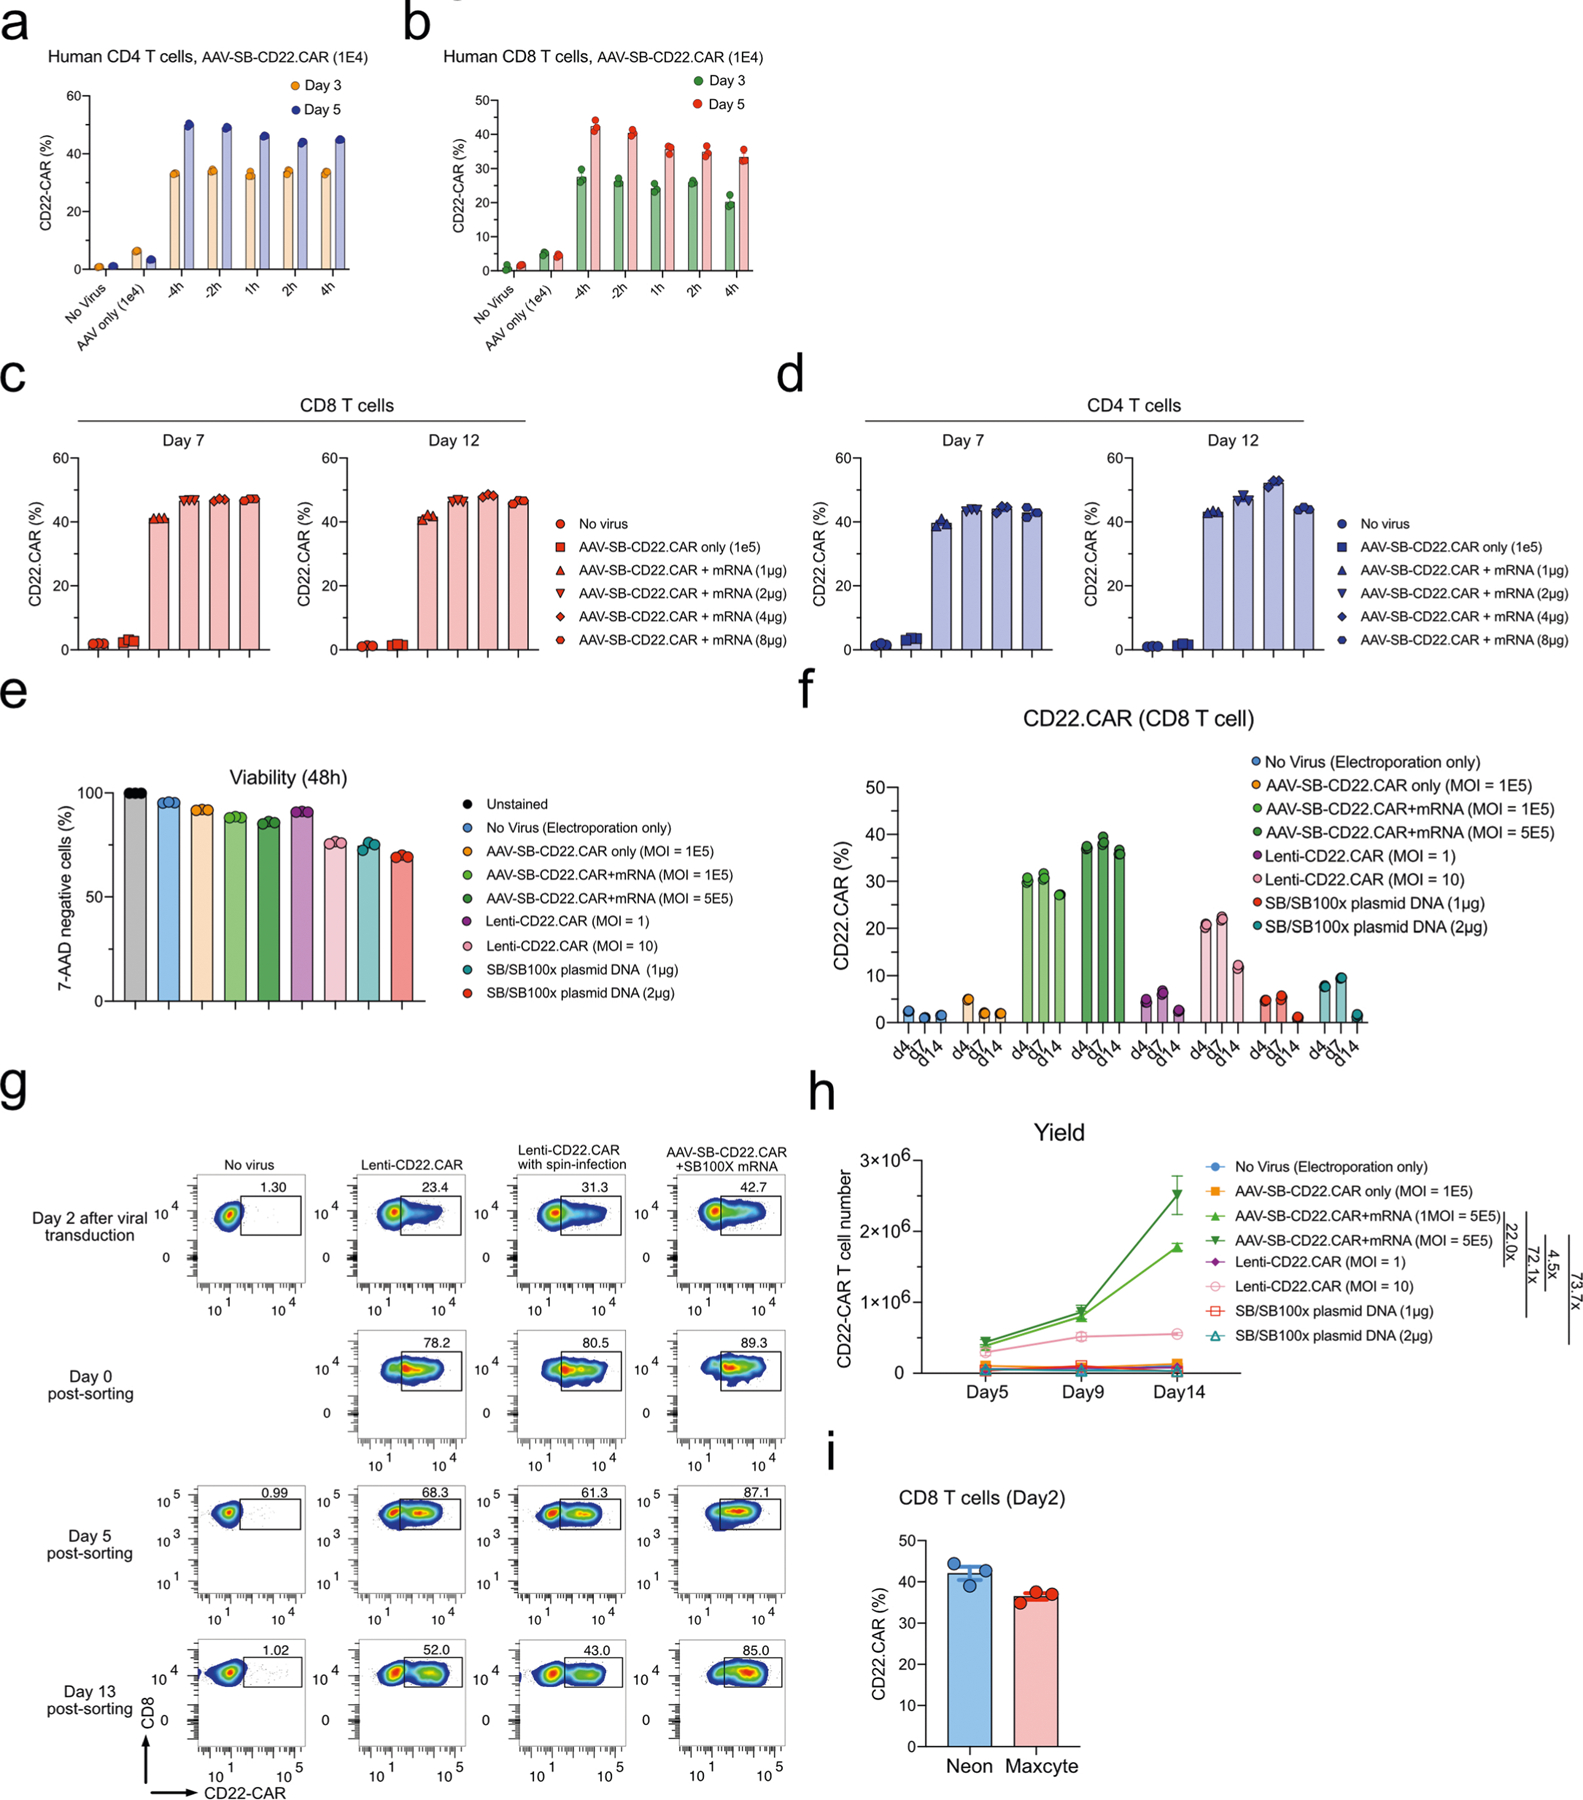
Extended Data Fig. 2 |. Timepoint optimization, SB100X transposase mRNA titration, and MAJESTIC CAR T yield.

a, Quantification of CD22.CAR T cell ratio for CD4 T cells that were transduced with AAV-SB-CD22.CAR virus at various time points. b, Quantification of CD22.CAR T cell ratio for CD8 T cells that were transduced with AAV-SB-CD22.CAR virus at various time points. c-d, Representative flow cytometry plots of CD22.CAR T cells produced via AAV-SB and a titrated serial of SB100X mRNA. (c) CD8 T cells. (d) CD4 T cells. e, Quantification of the cell viability of CD8 T cells. f, Quantification of CAR T cells. g, Flow cytometry plots of CAR T cell ratios before and after sorting. h, CD22.CAR T cell yield quantification (yield = total viable cell count × CAR-positive percentage). Cells were split into 3 technical replicates after electroporation. Yield is calculated for each technical replicate separately. i, CAR+ T cell generation efficiency (CAR+%) of MAJESTIC using Neon and Maxcyte approaches. In this figure, for optimization of conditions, each assay was done with one donor with three technical replicates. Donor 2 and donor 0286 T cells were used in this figure.
