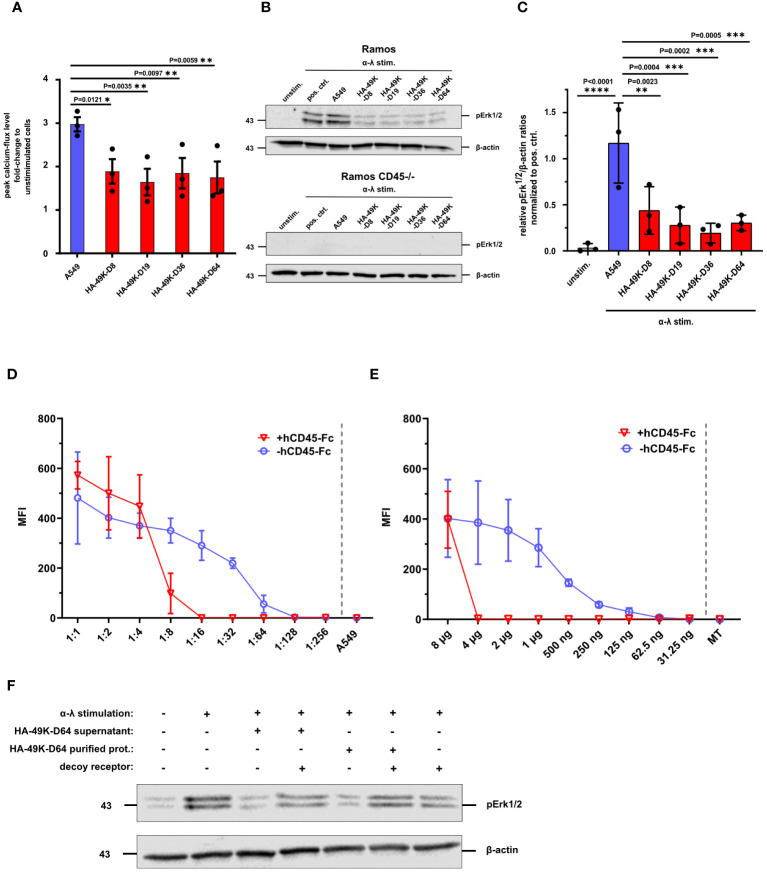
Figure 4.
Ramos B cell signaling is inhibited by HA-49K orthologs to comparable levels. Ramos B cell signaling was determined to assess the inhibitory potential of HA-49K orthologs in B cells. Previous incubation of Ramos cells with cell supernatants (red) containing various HA-49K orthologs was performed. Unstimulated cells (unstim.) were used as a negative control (grey), co-incubation with unreactive A549 supernatant (A549) served as a positive control indicated in blue. Cells were washed and stimulated via receptor cross-linking using α-λ Abs. The cellular calcium-response was detected by flow cytometry and the mean peak Ca2+-levels (columns) of 3 individual experiments (dots) including standard deviation are shown. Statistical differences compared to A549 were analyzed using two-way ANOVA test (A). Immunoblot analysis of pErk1/2 levels upon BCR stimulation of Ramos B cell lines with 1 µg/ml α-λ Abs for 2 min. Unstimulated cells (unstim.) served as negative control while α-λ treated cells (pos. crtl.) and co-incubation with A549 supernatant (A549) served as positive controls. Detection of β-actin levels was used as loading control. One representative blot for Ramos and CD45-/- Ramos cells is shown (B). The relative detection levels of pErk1/2 to β-actin ratios in Ramos cells were normalized to the positive ctrl. The mean (columns) of 3 individual experiments (dots) including standard deviation is shown. Statistical differences to the positive ctrl. were analyzed using the two-way ANOVA test. Only significant results were indicated in the panel (C). A two-fold dilution series of cell supernatants containing HA-49K-D64 (D) and purified HA-49K-D64 proteins starting at 8 µg per sample (E) was performed. Samples were either supplemented with 0.5 µg per sample hCD45-Fc (+hCD45-Fc, red) or without (hCD45-Fc, blue). After a 1 h incubation period, the binding of HA-49Ks to Ramos cells was detected using α-HA-based flow cytometry. Undiluted supernatant from untransfected A549 cells (A549) or the 8 µg MT protein were utilized as negative controls and shown as single values at the end of the x-axis separated by the grey dashed line. The mean MFI of 3 individual experiments is displayed for each, including standard deviation in the form of error bars. Erk1/2 phosphorylation was analyzed to investigate the prevention of the inhibitory effect HA 49K-D64 by hCD45-Fc receptors via immunoblotting. The supernatant containing HA-49K-D64 proteins was diluted 1:10 and 4 µg purified HA-49K-D64 proteins were incubated for 1 h with 500 ng hCD45-Fc decoy receptors as indicated in the figure. Subsequently, reagents were incubated with Ramos cells for 1 h Cells were lysed after BCR stimulation with 2 µg/ml α-λ Abs for 2 min. Sample loading was controlled by the detection of β-actin levels. One representative blot is presented (F).

