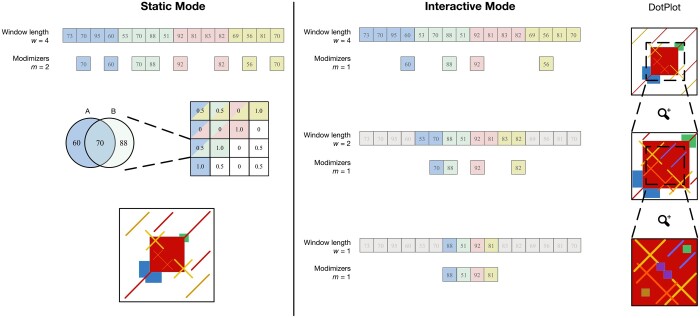
Figure 1.
Overview of ModDotPlot’s workflow for producing a self-identity plot. Static mode: Hashed k-mers are evenly partitioned into intervals of length w. Modimizers are selected based on an estimated sketch size m within each interval. For each pairwise combination of intervals, identity is computed and stored in a matrix Mw. Finally, a heatmap is created based on the color thresholds provided. Interactive mode: Three distinct modimizer partitions are produced from a minimum interval length of =1 up to w = 4. At launch, a heatmap is rendered for the largest window size (here, w = 4). When the field of view is zoomed by half (highlighted region), the dot plot is rendered using a submatrix created from the partition at w = 2. This process can extend until a plot produced from the minimum interval length is reached, with m remaining constant among all layers. While m = 1 is used here for demonstration, ModDotPlot adjusts the modimizer sparsity such that in practice

