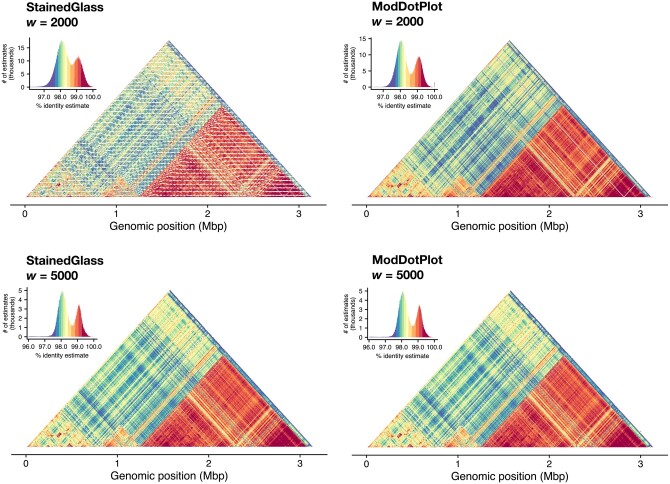
Figure 3.
Plots produced by StainedGlass (column 1) and ModDotPlot (column 2), representing the upper diagonal self-identity heatmap of the HG002 DXZ1 satellite array (ChrX:57,680,000–61,000,000). Rows represent a window size of 2000 (r = 1570 in ModDotPlot) and 5000 (r = 678) respectively. ModDotPlot was run with a default m = 1000. Plotting artifacts in the StainedGlass w = 2000 example are due to interactions between the partitioning window size and tandem repeat periodicity

