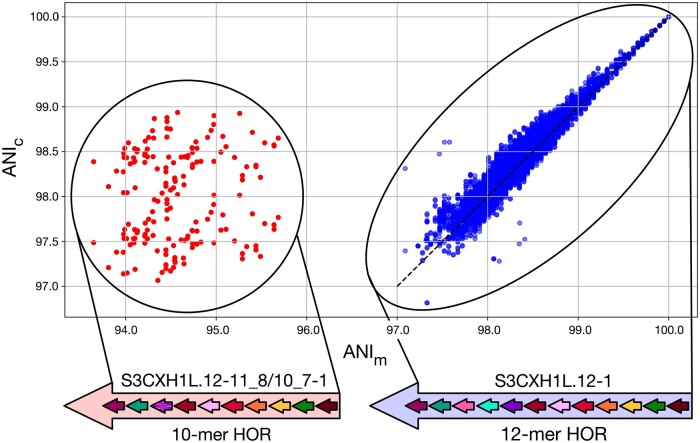
Figure 4.
Scatterplots showing the linear relationship between MUMmer ANIm and ModDotPlot ANIc, using CHM13 chrX:58 000 771–58 200 827. The outlier group labeled on the left represents a noncanonical 10-mer HOR (chrX:58 060 405–58 062 120), which is scored differently by the two methods due to the presence of a large deletion when compared to the 12-mer HOR. The dashed line represents ANIm = ANIc

