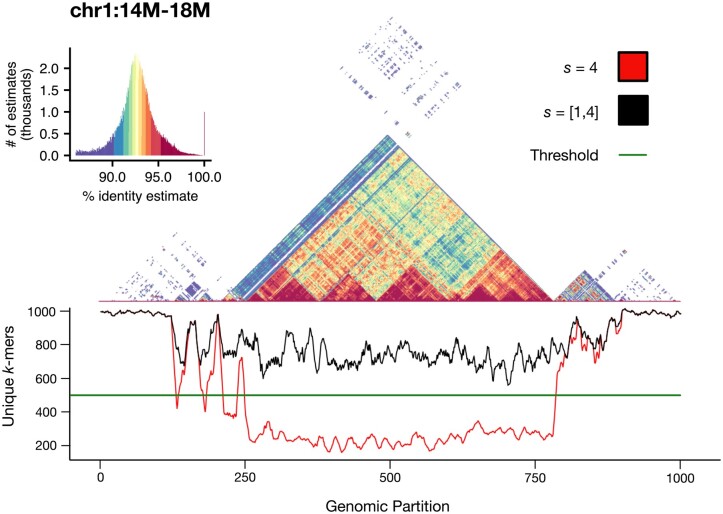
Figure 5.
Self-identity plot of the centromere of CHM13 Chromosome 1, overlaid with a smoothed unique k-mer frequency chart. Using a window size w = 4000 and a sparsity s = 4, the expected number of modimizers per window is m = 1000. When using an uncorrected sparsity value, the number of unique modimizers per window can drop to under 200. By detecting the unexpectedly small set sizes and adjusting the sparsity of these windows, the total number of modimizers in each window can be increased to at least (or, in pathological cases, all k-mers in the window)

