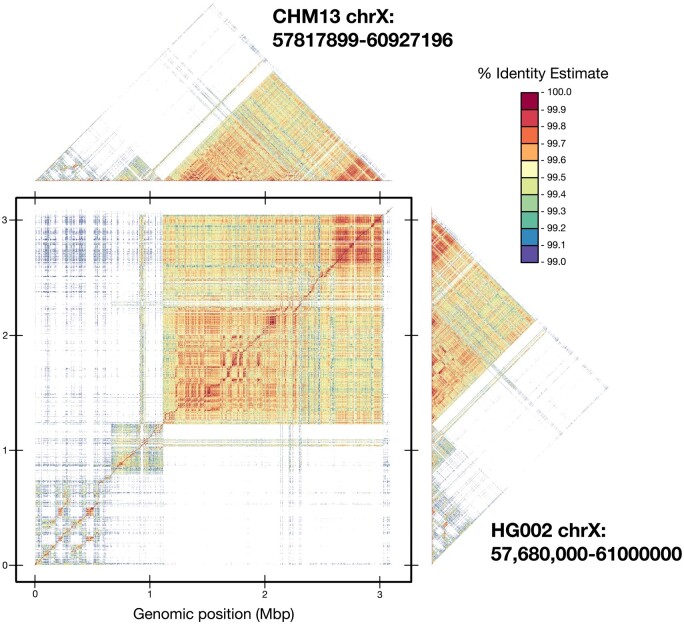
Figure 6.
Comparative dot plot of chromosome X DXZ1 satellite array from the HG002 and CHM13 genomes, overlaid with self-identity plots, using a 99% identity threshold. A faint, high-identity diagonal is visible in the comparative plot, indicating the orthologous sequences between these two highly variable arrays

