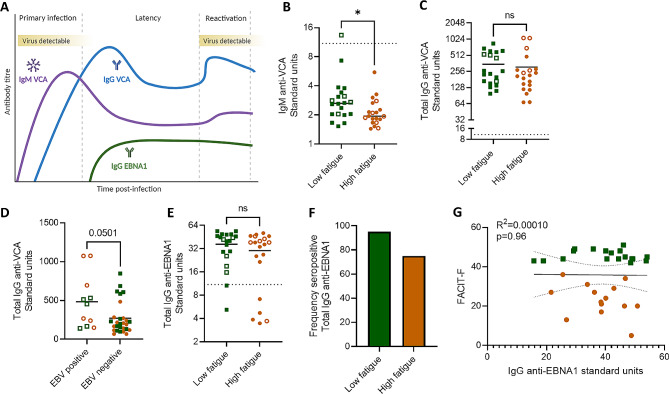
Fig. 3.
Anti-EBV seroresponse in people with post-stroke fatigue. (A) Schematic of expected circulating anti-EBV antibody titres following primary infection, and during latency, and reactivation. Created with BioRender. (B-G) Plasma antibodies to EBV were measured by ELISA. Low fatigue participants are plotted as green squares and high fatigue as orange circles. Open shapes indicate participants with EBV viremia, as measured by qPCR, and the dotted line (B, E, G) indicates the ELISA cut off control value. (B) Titre of anti-Epstein-Barr nuclear antigen 1 (EBNA1) IgG between participants with low versus high post-stroke fatigue. (C) Percent of participants within each group that are seropositive for anti-EBNA1 IgG. Seropositivity is considered any value > 10% over the cut-off control value. (D) Association between self-reported fatigue (FACIT-F) and IgG anti-EBNA1 titre. (E) Titre of IgG anti-viral capsid antigen (VCA) between low and high fatigue groups. (F) Titre of IgG anti-VCA between participants with and without EBV viremia, measured by qPCR. (G) Titre of IgM anti-viral capsid antigen (VCA) between low and high fatigue groups. Data show individual data points plus mean, (B, C, E, G) n = 20, (D) n = 12–30 per group.; *p < 0.05; (E) unpaired t-test (B, F, G) Mann-Whitney test; (D) linear regression, with best-fit line and 95% confidence band plotted

