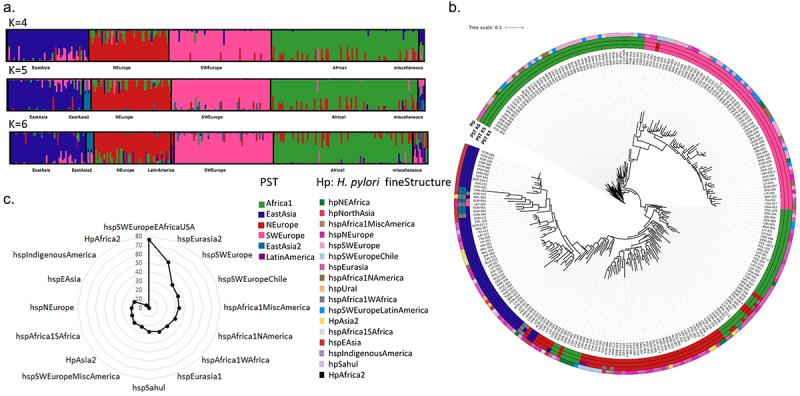
Figure 1.

Global overview of H. pylori prophage abundance and population structure.
(a) Prophage sequence typing (PST) based on the integrase and holin genes. The DISTRUCT plot of the Bayesian population was assigned using STRUCTURE and an admixture model for K populations (K = 4 to K = 6) for 260 genomes containing the prophage integrase and holin genes. Each prophage is represented by a vertical line divided into K colored segments representing the membership coefficients in each cluster. (b) Concatenated integrase and holin phylogenetic tree. Outer circles represent population membership for PST with 4, 5, and 6 populations assigned, and for the H. pylori fineSTRUCTURE assigned population. (c) Uneven prevalence of prophage elements by H. pylori ancestry (p < .0001). The percentage of prophage presence by H. pylori fineSTRUCTURE ancestry is indicated by a black line.
