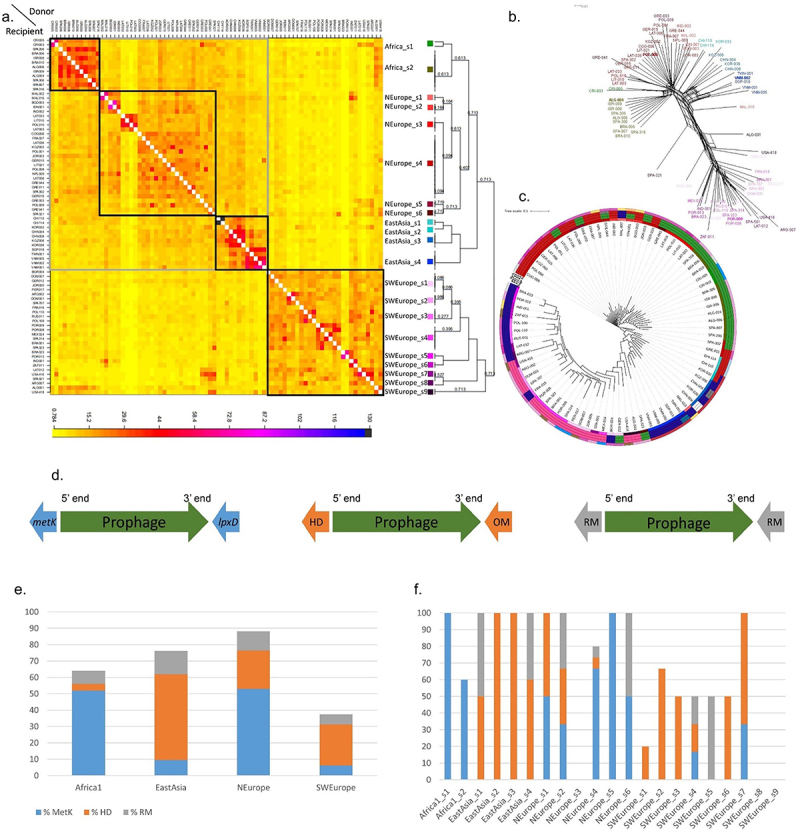
Figure 2.

Population structure and phylogenetics of the complete H. pylori prophages.
(a) Co-ancestry matrix of H. pylori prophage genomes. The color of each matrix square represents the expected number of fragments exported from a donor genome (column) to a recipient genome (row), inferred by Bayesian clustering in fineSTRUCTURE. The black and gray boxes indicate evidence of higher recombination between genomes based on the co-ancestry matrix. (b) SplitsTree phylogenetic network reconstructed using the complete genome alignment of 80 complete prophages. Prophage genomes in bold are reference prophage representative of the main populations. Tip colors correspond to those of Figure 2a. (c) Maximum-likelihood phylogenetic trees from complete prophage genome alignment. Circles from inside to outside: phage fs – prophage population determined by fineSTRUCTURE coded as in Figure 2a; PST K4, PST K5 and PST K6 – populations determined by phage sequencing typing (based on integrase and holin) coded as in Figure 1a; Hp fs - bacterial population determined by fineSTRUCTURE. (d) Schematic map of the prophage insertion sites. Prophage sequence is in green evidencing its 5’ end (left end) and 3’ end (right end). The most common insertion site is found from left to right between the bacterial genes: metK and lpxD (genes in blue); HD domain and outer membrane protein (genes in orange); and between RM genes (genes in gray). (e) Percentage of prophage insertion sites by PST K = 4, according to site: S-adenosylmethionine synthetase metK gene at 5’ end (%metK), HD family hydrolase gene at 5’ end (%HD), and flanked by restriction and modification (RM) genes (%RM). (f) Percentage of prophage insertion sites as in Figure 2d by fineSTRUCTURE population.
