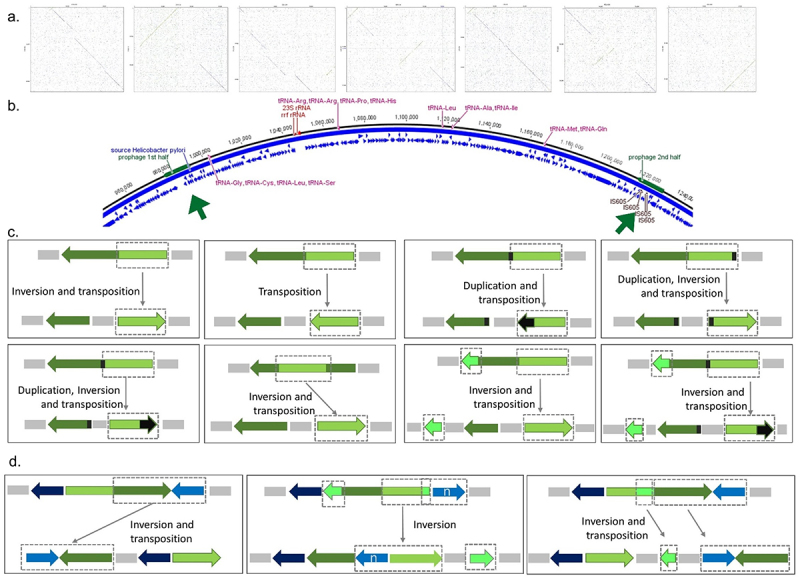
Figure 3.

Prophage inactivation by genome rearrangement in 298 complete genomes.
(a) Prophage genome inversion (present in 13; 4.4%) as shown by dotplots of 7 complete prophages with inversions, depicted as green lines in perpendicular directions. (b) Prophage split into two fragments across the bacterial genome, represented as green boxes and arrows (present in 49; 16.4%). (c) Schematic representation of prophage genome rearrangement involving inversion, transposition and/or duplication (present in 32; 10.7%). (d) Schematic representation of the case of bacterium and prophage genome rearrangement implying inversion and/or transposition (present in 17; 5.7%).
