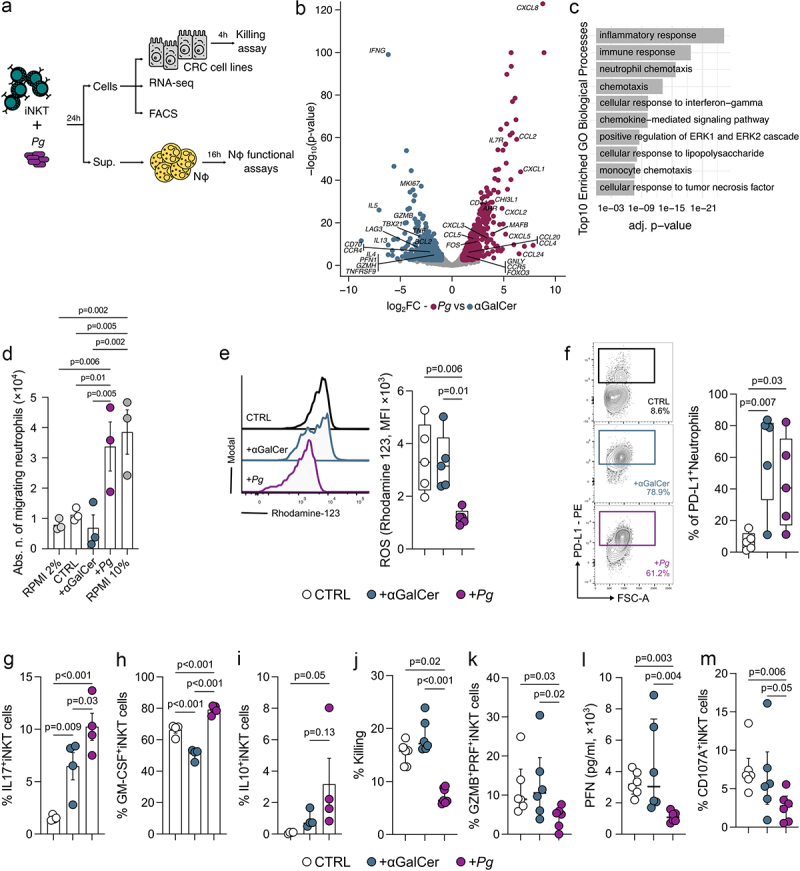
Figure 3.

P. gingivalis promotes the iNKT cell-mediated recruitment of TANs while impairing iNKT cell cytotoxicity. A) schematic representation of the experimental plan. B) volcano plot representing the differentially expressed genes (DEGs) in Pg- vs αGalCer-primed iNKT cells; the volcano plot shows for each gene (dots) the differential expression [log2fold-change (log2FC)] and its associated statistical significance (log10p-value). Dots indicate those genes with an fdr-corrected p < 0.05 and log2FC > |1|. C) gene ontology (GO) analysis of differentially expressed genes (Bonferroni-corrected p < 0.05 and log2FC >2). D) absolute numbers of migrating neutrophils upon exposure to RPMI + 2%FBS (negative control), RPMI + 10%FBS (positive control), unloaded moDC (CTRL), αGalCer- and pg-primed (+Pg) iNKT cell supernatants. Results are representative of three (n = 3) independent experiments. p < 0.05 (*), p < 0.01 (**), one-way ANOVA. E) respiratory burst assay quantification and F) frequency of PD-L1+ cells from neutrophils exposed to the culture supernatants of unloaded moDC (CTRL), αGalCer- and Pg-primed (+Pg) iNKT cells with representative plots. G-I) frequency of G) IL17+ H) GM-CSF+ and I) IL10+ iNKT cells upon stimulation with P. gingivalis. J) percentage of killed tumor cells by unloaded moDC (CTRL), αGalCer- and Pg-primed (+Pg) iNKT cells. K) frequency of GZMB+PFN+iNKT cells. L) perforin concentration in the culture supernatant of unloaded moDC (CTRL), αGalCer- and Pg-primed (+Pg) iNKT cells. M) frequency of CD107a+iNKT cells. Data are representative of at least three independent experiments.
