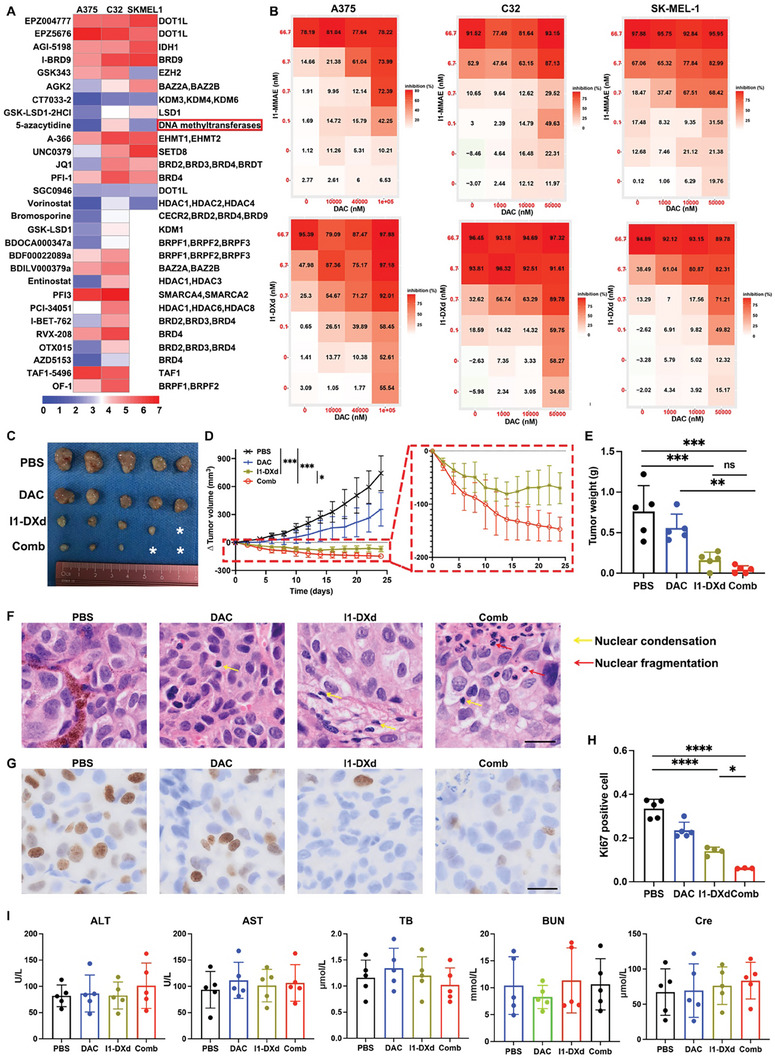
Figure 2.

Combination with DAC significantly enhances the ICAM1‐ADC anti‐tumor efficacy in vitro and in vivo. (A) Chemical screen of 29 epigenetic probes identifies DNMT1 inhibitor as potential therapeutic target for melanoma. The color scale represents the z‐score of IC50. The lower IC 50 values indicated stronger anti‐proliferative activities effect in melanoma cells; (B) Combined inhibitory effects of various combination matrix of ICAM1‐ADCs (0‐66.7 nM) and DAC (A375: 0–100 µM; C32 and SK‐MEL‐1:0‐50 µM) in melanoma cells; (C) Image of excised subcutaneous PDX tumor from mice treated with PBS (sham), DAC, I1‐DXd, or Combo group (n = 5 per group); (D) Δ tumor volume curve in PDX model by tumor volume measurement by caliper. *p < 0.05; ***p < 0.001; Bonferroni‐adjusted p value < 0.05 was considered statistically significant. (E) Tumor mass weight at end point of subcutaneous PDX tumors. **p < 0.01; ***p < 0.001; Bonferroni‐adjusted p value < 0.05 was considered statistically significant. (F) Representative HE image of tumor in different groups. Scale bar 20µm. Yellow arrow indicated nuclear condensation; red arrow indicated nuclear fragmentation; (G) Representative Ki67 IHC staining image of tumor in different groups. Scale bar 20µm; (H) Quantitation of Ki67 positive cell proportion in different groups. *p < 0.05; ***p < 0.001; Bonferroni‐adjusted p value < 0.05 was considered statistically significant. (I) Blood chemistry parameters (ALT, AST, TB, BUN and Cre) measured when treated mice were sacrificed in different groups.
