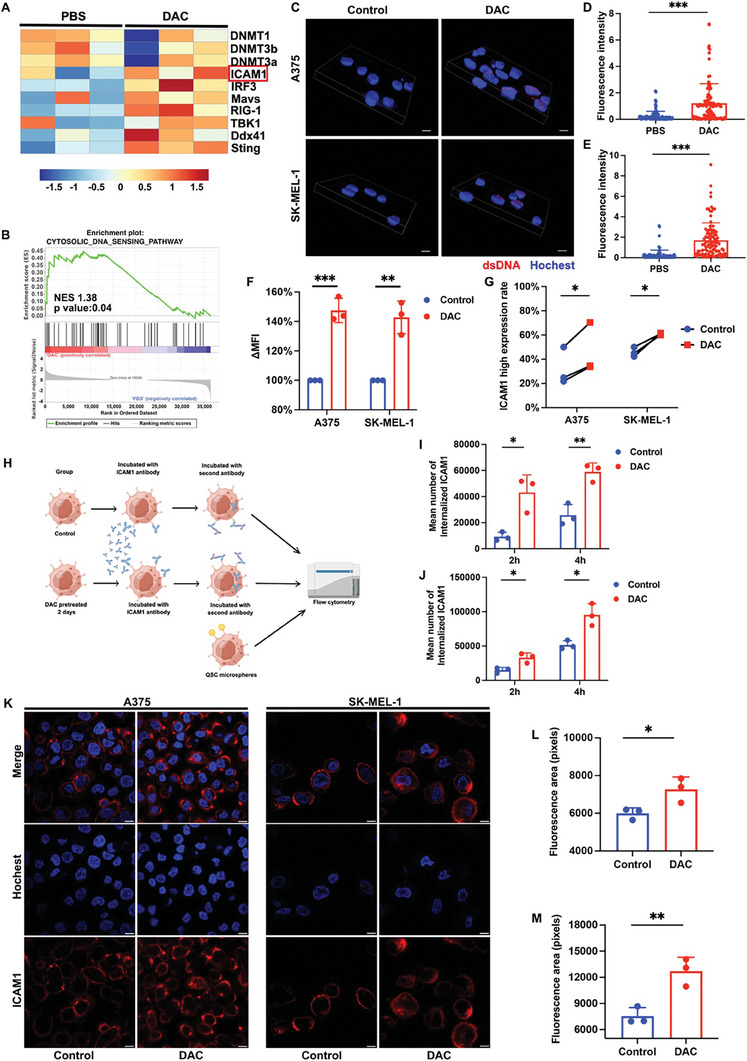
Figure 5.

DAC induces ICAM1 expression and increases the internalization of ICAM1 antibody. (A) Heat map showing the down‐regulation of DNMTs and up‐regulation of ICAM1 and dsDNA sensor genes in the DAC group compared with PBS group; (B) GSEA for gene sets associated with cytosolic DNA sensing pathway in DAC group vs. PBS group; (C) Representative images of IF staining of dsDNA in different groups. Scale bar 10 µm; (D‐E) Quantitative fluorescence intensity analysis of dsDNA in A375 cells (D) and SK‐MEL‐1 cells (E). ***p < 0.001; (F) MFI change calculated by flow cytometry after DAC treatment. n = 3 biological replicates; (G) Quantitative analysis of ICAM1 high expression rate after DAC treatment. n = 3 biological replicates. ICAM1 high expression rate was defined by the rate of cells with ICAM1 expression higher than the middle point of the peak of the highest expressing sample in each cell line; (H) Schematic illustration for ICAM1 antibody internalization assay; (I) Quantitative analysis of ICAM1 antibody internalization at 2h and 4 h after DAC treatment in A375 cell (I) and SK‐MEL‐1 cell (J). *p < 0.05; **p <0.01; (K) Representative images of IF staining of ICAM1 antibody at 4 h after DAC treatment. Scale bar 10 µm; (L‐M) Quantitative fluorescence area analysis of tumor cell exposure to ICAM1 antibody at 4 h after DAC treatment in A375 cell (L) and SK‐MEL‐1 cell (M). *p < 0.05; **p <0.01.
