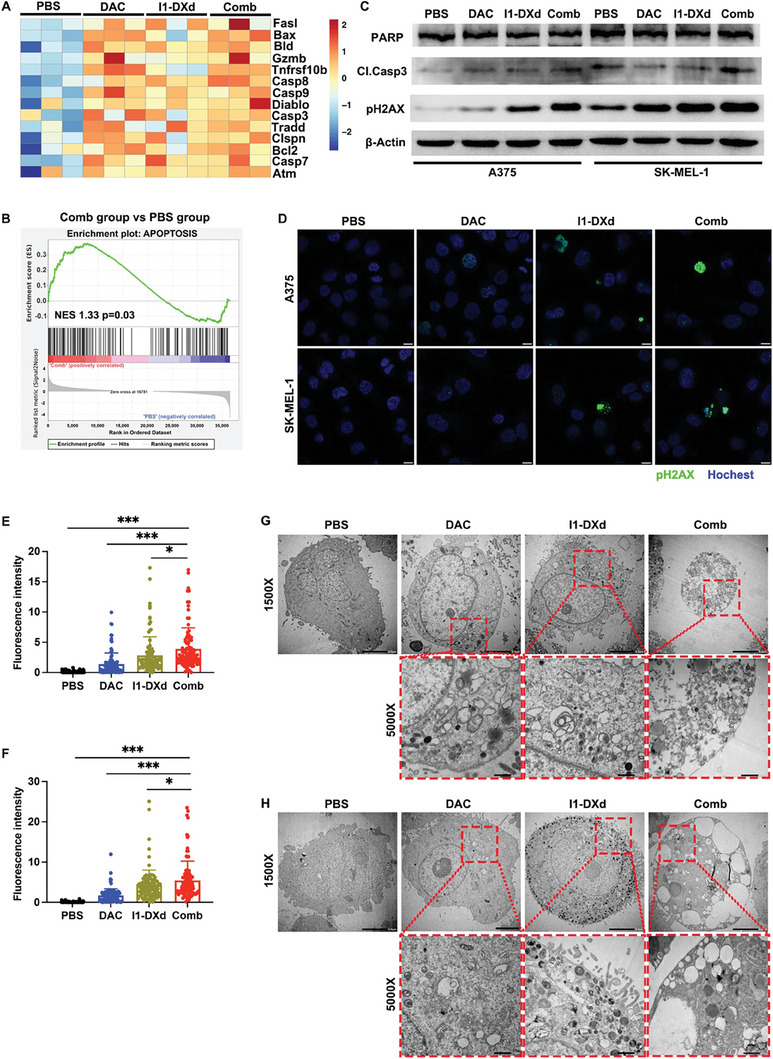
Figure 6.

DAC enhances the anti‐tumor efficacy of I1‐DXd by synergistically inducing apoptotic cancer cell death. (A) Heat map of apoptosis‐related genes expression in different groups; (B) GSEA for gene sets associated with apoptosis pathway in the Combination group vs. PBS group; (C) Western blots showing the DNA damage and apoptosis response followed by I1‐DXd monotherapy or combination treatment with DAC. β‐Actin is the loading control; (D) Representative images of IF staining of pH2AX in different groups. Scale bar 10 µm; (E‐F) Fluorescence intensity analysis of pH2AX in different groups in A375 cell (E) and SK‐MEL‐1 cell (F) (n = 100 cells per group); *p < 0.05; ***p < 0.001; Bonferroni‐adjusted p value < 0.05 was considered statistically significant. (G‐H) Representative TEM image of A375 (G) and SK‐MEL‐1 (H) after different treatment for 24h.
