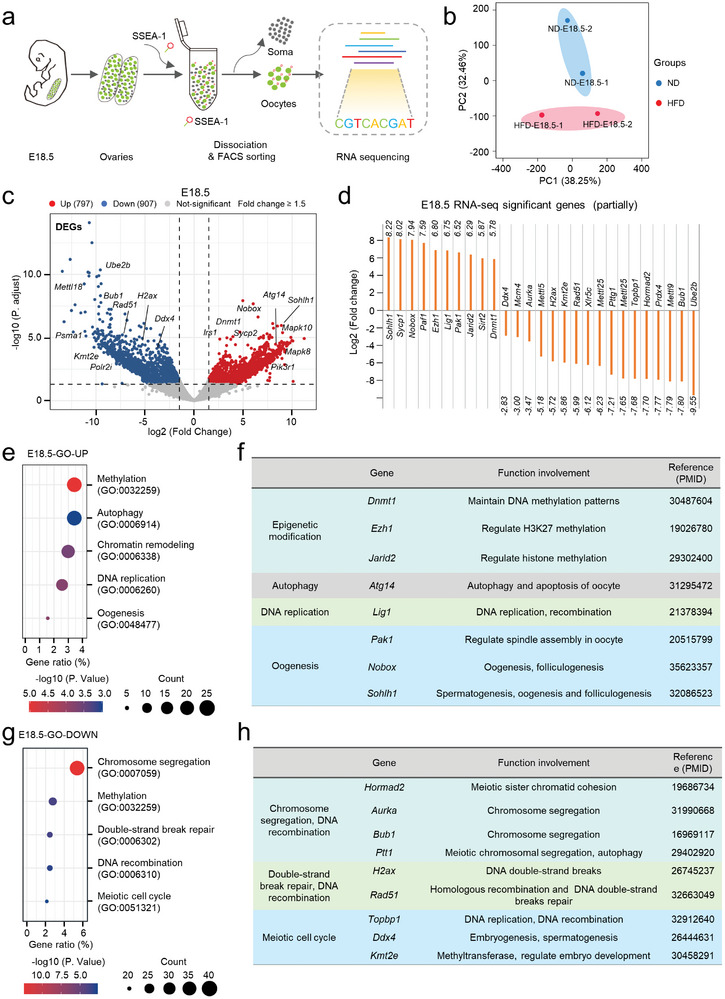
Figure 4.

Profiling gene expression of fetal oocytes with RNA sequencing. a) Flowchart overview of fetal oocyte RNA‐seq. Fetal oocytes were collected from E18.5 ND and HFD female mice (300 oocytes from 10 fetuses per sample, two samples for each group). b) Volcano plot depicting differentially expressed genes (DEGs) in HFD fetal oocytes at E18.5 compared to ND ones (downregulated genes in blue, upregulated genes in red). c) Expression of select differentially expressed genes in HFD E18.5 fetal oocytes as measured by RNA‐seq. d,f) GO enrichment analysis results for upregulated and downregulated DEGs in HFD fetal oocytes compared to ND ones. e,g) Function and reference display of differentially expressed genes.
