
Figure 5.
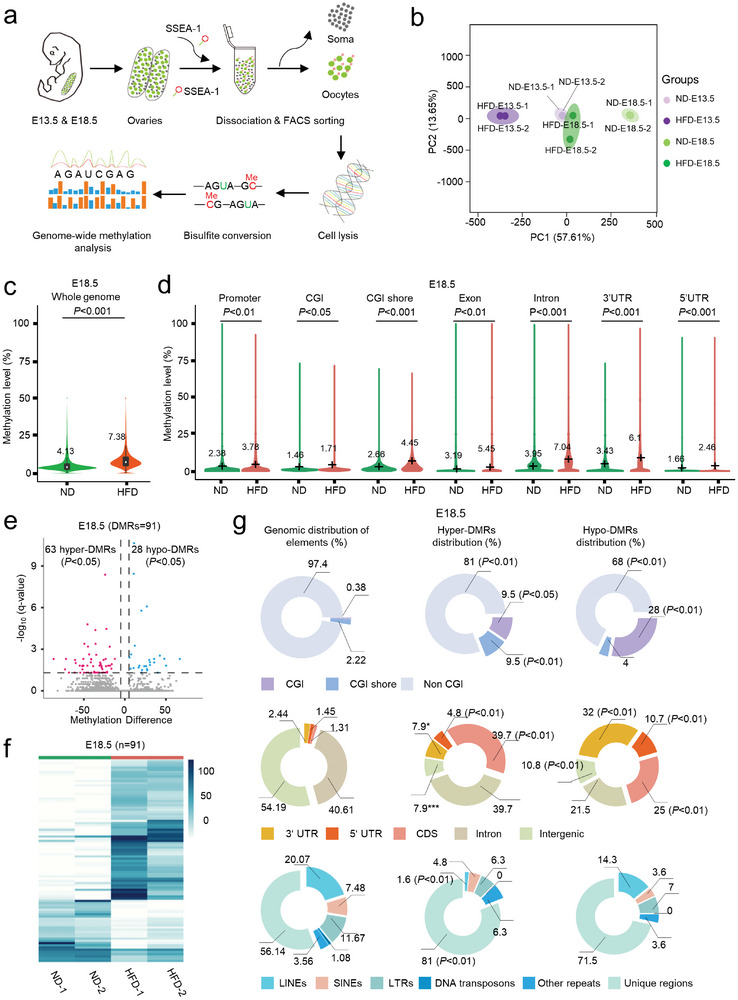
Global DNA hypermethylation across various genomic features in fetal oocytes from HFD mice. a) Flowchart illustrating the BS‐seq procedure for genome‐wide methylation analysis, involving the collection of fetal oocytes, bisulfite conversion of DNA, and library preparation for high‐throughput sequencing. Fetal oocytes were collected from E18.5 ND and HFD female mice (300 oocytes from 10 fetuses per sample, two samples for each group). b) Average methylation levels in the genome of fetal oocytes at E18.5. c) Violin plots displaying methylation levels for different genomic features, including promoters, CGIs, CGI shore, exon, intron, 3′UTR, and 5′UTR in fetal oocytes. The mean methylation levels are denoted by numerical values and black crosses. Statistical analyses were conducted using a bootstrap test. d) Volcano plot depicting the results of DNA methylation microarray analysis in fetal oocytes from ND and HFD backgrounds at E18.5. Dots positioned in the upper left corner represent significantly hypermethylated probes, while those in the upper right corner represent significantly hypomethylated probes with a statistical significance of P < 0.05 and a fold change >1.5. e) Heatmap visualization illustrating differentially methylated regions (DMRs) in ND and HFD fetal oocytes at E18.5, where each line represents a distinct DMR. High methylation levels are denoted in blue, while low methylation levels are depicted in white. f) The relative proportion of DMRs among CpG Islands (CGIs) and CGI shores (top), the relative proportion of DMRs among coding and noncoding regions (middle), and the relative proportion of DMRs among distinct sequence and repetitive elements throughout the genome (bottom). Fisher's exact test was employed to assess potential enrichment or depletion of DMRs relative to the genomic distribution of these elements: a008375 significance was set at P‐value <0.05.