Figure 2.

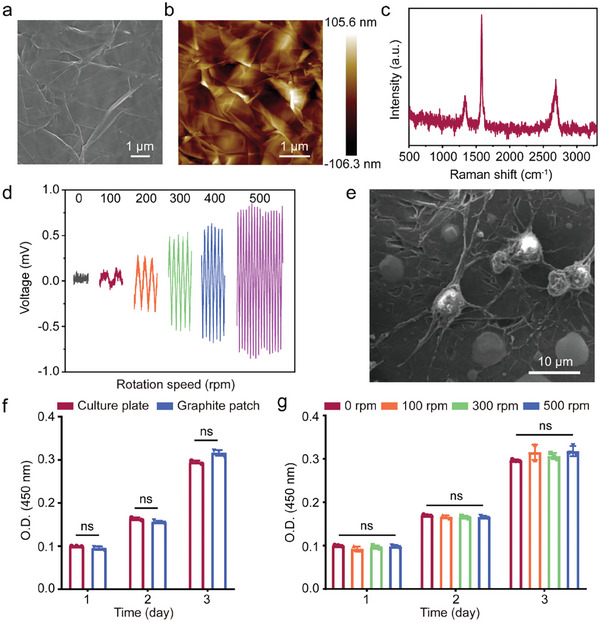
a) SEM and b) AFM images of the graphite patch. c) Raman spectra of the graphite patch. d) The voltage generated on the graphite patch when placed under a rotating magnetic field at rotation speeds of 0, 100, 200, 300, 400, and 500 rpm. e) SEM image of NSCs cultured on the graphite patch for 3 days. f) Proliferation of NSCs after culture on the graphite patch for 1, 2, and 3 days. NSCs seeded in the culture plate served as control. g) Viability of NSCs on the graphite patch when changing magnetic field at rotation speeds of 0, 100, 300, and 500 rpm was applied. The data were expressed as the mean ± standard deviation (n = 3), as analyzed by a one‐way ANOVA, with Tukey's multiple comparisons test (nsp > 0.05).
