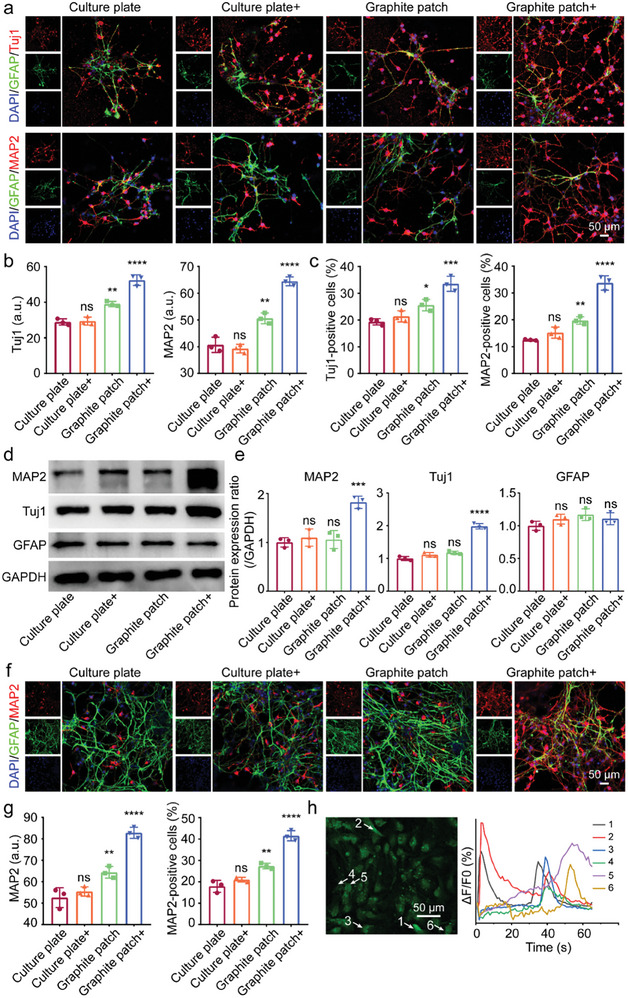
Figure 4.

a) Immunofluorescence images of Tuj1, MAP2, and GFAP of NSCs on culture plate or graphite patch without or with (+) a 500‐rpm magnetic field at day 5. Tuj1 and MAP2 was stained red. GFAP was stained green. While nuclei were stained blue by DAPI. b) Fluorescence intensity analysis of Tuj1 and MAP2 based on immunofluorescence staining results in a). c) Evaluation of Tuj1‐positive cells and MAP2‐positive cells based on immunofluorescence staining results in a). d) Western blot results of MAP2, Tuj1, and GFAP of NSCs on culture plate or graphite patch without or with (+) a 500‐rpm magnetic field at day 5. e) The gray value analysis of western blotting results in d). f) Immunofluorescence images of MAP2 and GFAP of NSCs on culture plate or graphite patch without or with (+) a 500‐rpm magnetic field at day 10. g) MAP2 fluorescence intensity analysis and MAP2‐positive cells evaluation at day 10. h) Fluorescence image and the corresponding fluorescence intensity analysis of NSCs cultured on the graphite patch under 500‐rpm magnetic field after stimulation with acetylcholine. The arrows indicate the cells exhibiting the changes in fluorescence intensity. The data were expressed as the mean ± standard deviation (n = 3), as analyzed by a one‐way ANOVA, with Tukey's multiple comparisons test (nsp>0.05, *p<0.05, **p<0.01, ***p<0.001, and ****p<0.0001 compared to the culture plate group).
