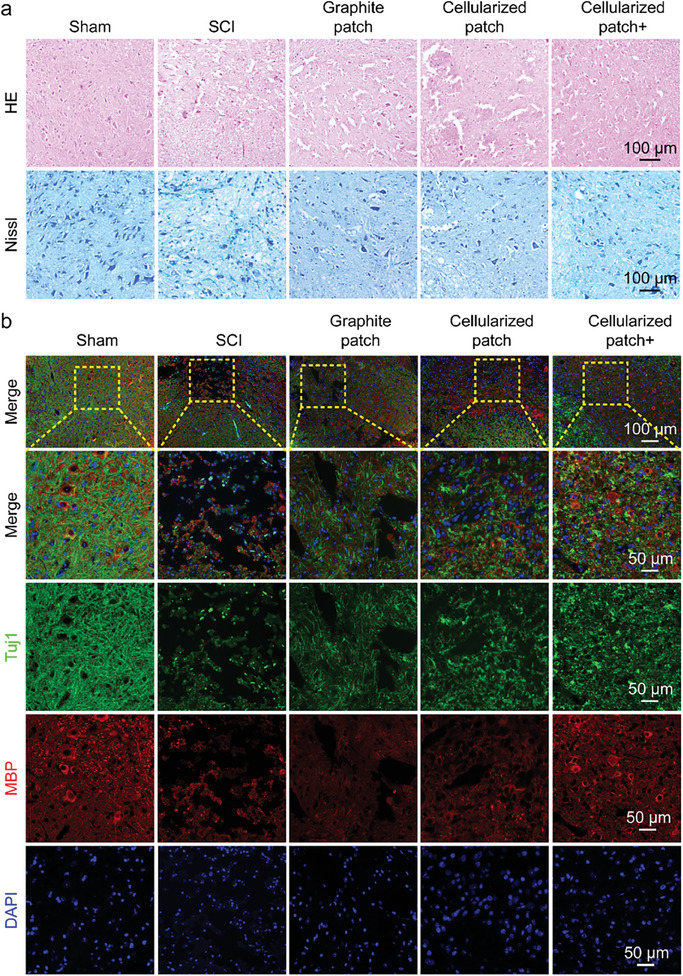
Figure 6.
a) H&E staining and Nissl staining of the spinal cord tissues of the mice in sham, SCI, graphite patch, cellularized patch, and cellularized patch+ groups at day 14. b) Immunofluorescence images of the spinal cord tissues of the mice in sham, SCI, graphite patch, cellularized patch, and cellularized patch+ groups at day 14. Tuj1, MBP, and nuclei were stained green, red, and blue, respectively. c) Statistical analysis of the average cavities, Nissl densities, as well as the fluorescence intensities of Tuj1 and MBP based on the H&E, Nissl, and immunostaining results in a,b). The data were expressed as the mean ± standard deviation (n = 5), as analyzed by a one‐way ANOVA, with Tukey's multiple comparisons test (*p<0.05, **p<0.01, and ***p<0.001).


