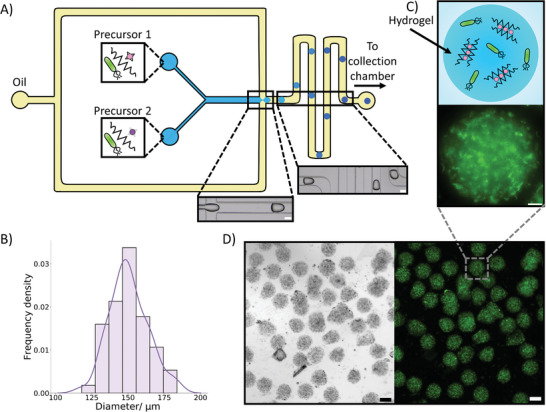
Figure 2.

Microfluidic production and properties of bacteria‐containing microgels. A) A schematic of our microfluidic device demonstrating the production of the microgels containing bacteria. Two aqueous precursor solutions containing the bacteria meet an oil stream at a flow focusing junction where microgel precursor droplets stabilized by span 80 are formed. The precursor droplets gelate through an ion exchange reaction where the Zn2+ ions (purple circles) in the Zn‐EDDA complex (grey star) displace the Ca2+ (pink circles) from the Ca‐EDTA complex (black star). This allows the Ca2+ ions to crosslink the alginate (zig‐zag lines) into an egg box structure. This forms the microgel beads. The microgel beads are then collected in an external collection chamber. The brightfield images demonstrate the production of the precursor droplets and the travel of the droplets through meanders where gelation will occur. The scale bars are 100 µm. B) A histogram with a kernel density estimation fit demonstrating the diameter of the produced bacteria containing microgels. Mean diameter was 151 µm with a polydispersity index of 0.0076 (n = 60). C) A diagram and fluorescence image of a single bacteria‐containing microgel after bacteria expression, where the localization of fluorescent signal in the bacteria can be seen. The scale bar is 20 µm. D) Brightfield and fluorescence images of a population of bacteria‐filled microgels after bacteria protein expression. The bacteria fluorescence can be seen to be localized within the gels. The scale bars are 100 µm.
