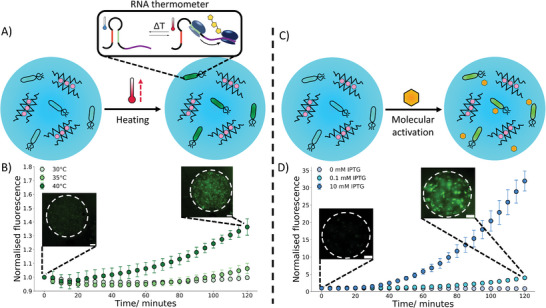
Figure 3.

Activation of hydrogel embedded bacteria through biophysical and biochemical cues. A) A schematic demonstrating the activation of bacteria in response to temperature, upon heating a localized fluorescent signal is produced within the embedded bacteria through the expression of GFP due to the activation of an RNA thermometer. B) A 2‐hour timelapse with embedded images showing how temperature impacts the fluorescence signal of the embedded bacteria controlled by RNA thermometers. Upon heating to 40 °C where the thermometer is in an “ON” state an increase in GFP expression can be seen. At lower temperatures where the thermometer is in an “OFF” state little to no increase in fluorescence signal is seen. The microscopy images at 0 and 2 hr show the fluorescent signal from the bacteria, and the dotted lines show the hydrogel boundary. C) A diagram depicting the activation of bacteria in the presence of a chemical signal (IPTG). The IPTG enables the localized production of GFP in the bacteria. D) A 2‐hour timelapse graph with embedded microscopy images demonstrating IPTG concentration dependence at 30 °C. With an increase in IPTG concentration, a greater increase in fluorescence is observed. The microscopy images at 0 and 2 hr show the fluorescent signal from the bacteria, and the dotted lines show the hydrogel boundary. The error bars indicate 1 standard deviation from n = 10 hydrogel beads. The scale bar on all the microscopy images is 20 µm.
