Figure 1.

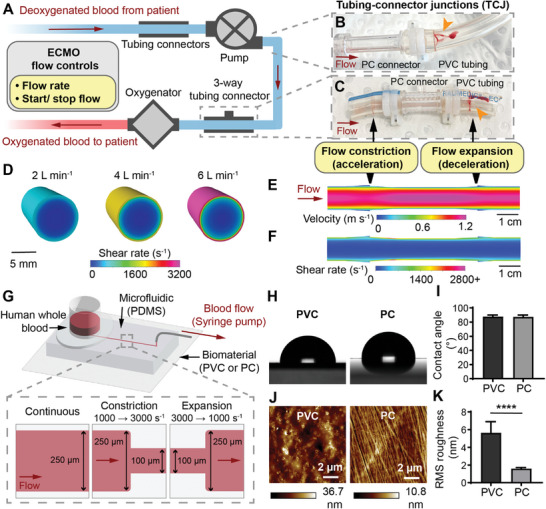
Replicating ECMO tubing thrombosis conditions on‐a‐chip. A) Schematic of ECMO circuit configuration and flow controls. B) ECMO pump outlet connector to tubing junction, showing thrombus (orange arrowhead). C) ECMO 3‐way TCJ showing thrombus (orange arrowhead). D) CFD model of the wall shear rate in ECMO tubing at flowrates of 2, 4 and 6 L min−1. CFD model of the E) velocity and F) shear rate, in an ECMO TCJ at 4 L min−1. G) Schematic of the ECMO thrombosis‐on‐a‐chip microfluidic model, and channel dimensions for different flow regimes. H) Representative photographs of the water contact angle on PVC and PC. I) Water contact angle of PVC and PC showed no significant difference (n = 9 droplets). J) Representative atomic force micrographs of PVC and PC. K) The RMS roughness of PVC was significantly greater than PC (n = 9 scans). Error bars are mean ± SD. Significance comparisons are *P < 0.05, **P < 0.01, ***P < 0.001, ****P < 0.0001 by an unpaired Student's t‐test.
