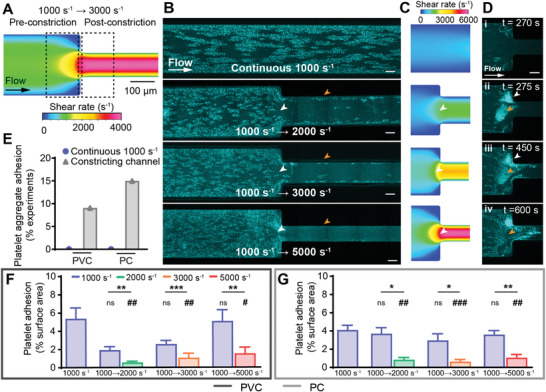
Figure 3.

Accelerating flow regions decreased platelet adhesion and promoted embolism. A) Schematic of the 1000 to 3000 s−1 constricting microfluidic, with dotted boxes representing areas for statistical analysis. B) Representative confocal micrographs of platelet adhesion (cyan) on PVC after 10 min of perfusion at continuous flow, or accelerating from 1000 s−1 to 2000, 3000, or 5000 s−1. Scale bar = 50 µm. C) CFD model of the wall shear rate in tested constricting microfluidic channels. D) Representative confocal micrograph time‐course of a 1000 to 5000 s−1 PC microfluidic channel showing platelet aggregate adhesion and embolism over time. Scale bar = 50 µm. E) Percentage of experiments with platelet aggregate adhesion in continuous and constricting microfluidic channels on PVC (n = 0/19 and n = 2/22 respectively) and PC (n = 0/21 and n = 3/20 respectively). Analysis of total fluorescent surface area indicating platelet adhesion at 10 min on F) PVC and G) PC constricting channels. Error bars are mean ± SEM, n = 5 donors where platelet aggregate adhesion did not occur. Significance comparisons between pre‐ and post‐constriction platelet adhesion for each constricting channel are *P < 0.05, **P < 0.01, ***P < 0.001 by a paired Student's t‐test. Significance comparisons to the continuous 1000 s−1 channel are #P < 0.05, ##P < 0.01, ###P < 0.001 by an ordinary one‐way ANOVA with Bonferroni's post hoc test.
