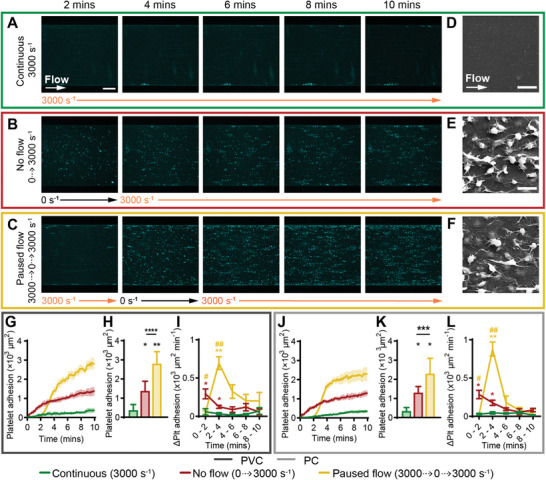
Figure 6.

Stopping flow followed by 3000 s−1 increased platelet adhesion on PVC and PC. Representative confocal micrographs of platelet adhesion (cyan) on PVC over 10 min of flow at A) continuous 3000 s−1, B) no flow (0 to 3000 s−1) and C) paused flow (3000 to 0 to 3000 s−1). Scale bar = 50 µm. Representative scanning electron micrographs of platelet morphology on PVC at the mid‐width of the channel, after 10 min of perfusion at D) continuous 3000 s−1, E) no flow, and F) paused flow. Scale bar = 5 µm. Total fluorescent surface area indicating platelet adhesion over 10 min on G) PVC and J) PC. Analysis of total platelet adhesion at 10 min showed a statistically significant increase from continuous 3000 s−1 to 0 to 3000 s−1 and 3000 to 0 to 3000 s−1 conditions, and between 0 to 3000 s−1 to 3000 to 0 to 3000 s−1, on both H) PVC and K) PC. Analysis of platelet adhesion rate over 2‐minute periods showed no flow significantly increased the rate of adhesion between t = 0 – 4 min and paused flow significantly increased the rate of adhesion between t = 2 – 4 min on both I) PVC and L) PC. Error bars are mean ± SEM, n = 5 donors. Significance comparisons are *P < 0.05, **P < 0.01, ***P < 0.001, ****P < 0.0001 compared to continuous 3000 s−1, or #P < 0.05, ##P < 0.01 compared to no flow (0 to 3000 s−1) by an ordinary one‐way ANOVA (H,K) or two‐way ANOVA (I,L). (H,K) Significance presented compared to continuous 1000 s−1 flow unless otherwise indicated). (I,L) Red asterisk compared no flow to continuous 1000 s−1 flow, yellow asterisk compared paused flow to continuous 1000 s−1, yellow hash compared paused flow to no flow.
