Figure 7.

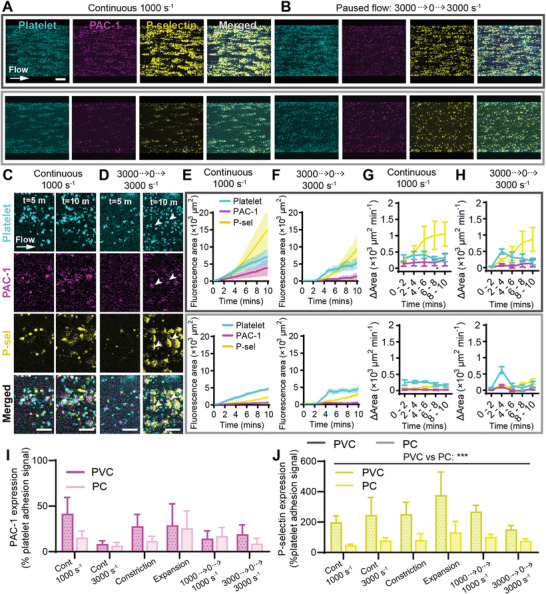
Platelet activation marker P‐selectin expression was increased on PVC compared to PC. Representative confocal micrographs of total platelet adhesion (cyan) and platelet activation markers PAC‐1 (magenta) and P‐selectin (yellow) expression on PVC (top row) and PC (bottom row) after 10 min at flow conditions of A) continuous 1000 s−1 and B) 3000 to 0 to 3000 s−1. Scale bar = 50 µm. Representative confocal micrographs showing platelet, PAC‐1, and P‐selectin co‐localization or spreading at t = 5 min compared to t = 10 min at flow conditions of C) continuous 1000 s−1 and D) 3000 to 0 to 3000 s−1. Scale bar = 5 µm. Total fluorescent surface area indicating platelet adhesion, PAC‐1, and P‐selectin expression over 10 min on PVC (top row) and PC (bottom row) at flow conditions of E) continuous 1000 s−1 and F) 3000 to 0 to 3000 s−1. Platelet adhesion, PAC‐1, and P‐selectin expression rate over 2‐minute periods at flow conditions of G) continuous 1000 s−1 and H) 3000 to 0 to 3000 s−1. I) PAC‐1 and J) P‐selectin expression as a percentage of platelet core signal at t = 10 min, analyzed between PVC compared to PC, and between all tested flow conditions, showed that PAC‐1 and P‐selectin expression was independent of flow condition, but PVC caused more P‐selectin expression than PC. Error bars are mean ± SEM, n = 5 donors. Significance comparisons in I,J by an ordinary two‐way ANOVA with Bonferroni's post hoc test. Significance comparisons are *P < 0.05, **P < 0.01, ***P < 0.001.
