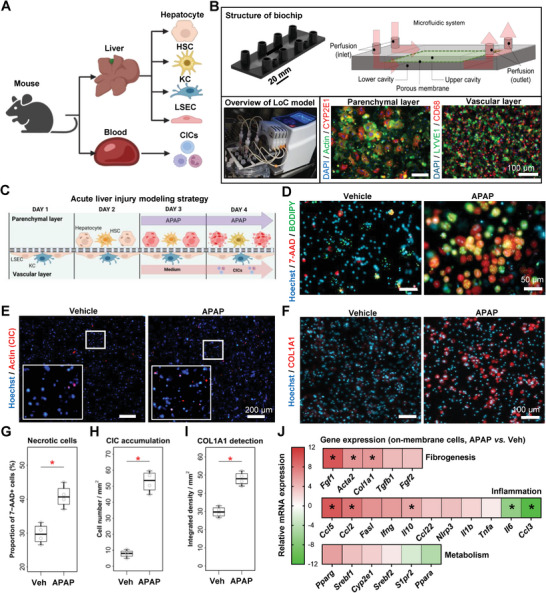
Figure 2.

Designing and validating a microfluidically perfused LoC for acute liver injury modeling. A) Schematic view of the liver and circulating cells isolated prior to LoC seeding. B) LoC set‐up depicting liver cell organization into the LoC during CIC perfusion. The upper image depicts the biochip used in this model. The lower left photograph shows the experimental set‐up within the cell culture incubator, including a peristaltic pump. The lower right microscopy images show the two layers of cells, staining by immunocytochemistry for the indicated markers. C) Experimental outline of the acute APAP injury model in the LoC. Fluorescence microscopy was used to visualize D) cell death (parenchymal layer), E) labeled CIC attachment to the membrane (vascular layer), and F) collagen 1A1 expression (parenchymal layer); quantitation is shown in (G–I), respectively. J) Total mRNA was extracted from the membrane at the end of the experiments, and gene expression was analyzed. Data shows the relative gene expression in APAP‐treated LoC as compared to vehicle. Individual points are depicted in Figure 5A–C (Supporting Information). Sample sizes: B–J) n = 4 per group. Abbreviations: APAP: acetaminophen; CICs: circulating immune cells; Ccl: Chemokine (C‐C motif) ligand; COL1A1: collagen, type I, alpha 1; GM‐CSF: granulocyte‐macrophage colony‐stimulating factor; HSC: hepatic stellate cell; IL: interleukin; IFN: interferon; KC: Kupffer cell; LSEC: liver sinusoidal endothelial cell; Tnfa: tumor necrosis factor‐alpha; Veh: vehicle. Paired student's t‐tests were performed. *p < 0.05 as compared to vehicle.
