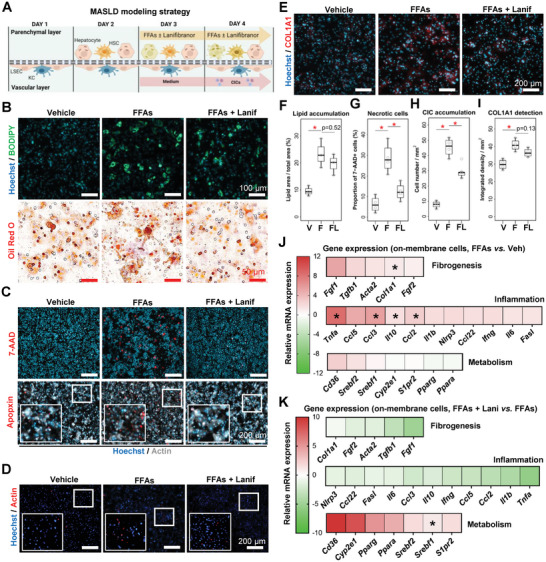
Figure 3.

The LoC for modeling key features of MASLD and therapeutic effects of lanifibranor. A) Experimental outline of the FFA‐induced MASLD model in the LoC. B) Lipid vesicle accumulation in LoC hepatocytes was verified by BODIPY and Oil Red O staining. C) Cell death was visualized by 7‐AAD and Apopxin staining, D) immune cell recruitment by using reporter CICs, and E) collagen accumulation by immunostaining. B–E) Parenchymal layer. F–I) Staining quantitation from the staining displayed in panels (B–E). Relative gene expression was assessed from the LoC membrane, and is displayed either as J) FFA‐treated relative to vehicle, or K) FFA plus lanifibranor relative to FFA plus vehicle. Individual points are depicted in Figure S7A–C (Supporting Information). Sample sizes: B–K) n = 4 per group. Abbreviations: COL1A1: collagen, type I, alpha 1; CICs: circulating immune cells; F or FFA: free‐fatty acid treated; FL or FFAs + Lanif: free fatty acid plus lanifibranor; V or Veh: vehicle. Paired student's t‐tests were performed. *p < 0.05 as indicated or as compared to vehicle.
