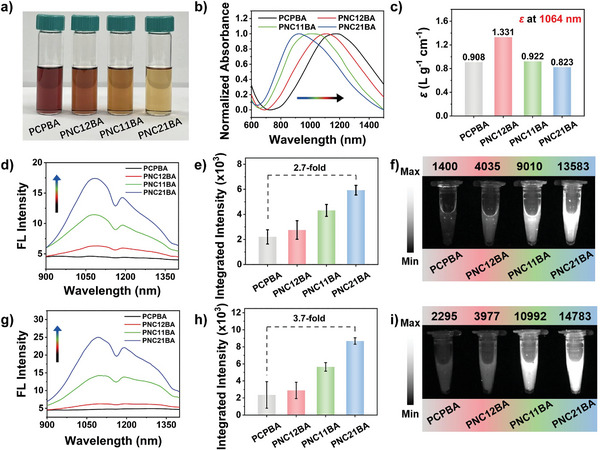
Figure 1.

Characterization of NDCPEs (PCPBA, PNC12BA, PNC11BA, and PNC21BA) in DCM. a) Images of NDCPEs in DCM (1.0 mg mL−1). b) Normalized absorption spectra and c) ɛ 1064 of NDCPEs. d) NIR‐II fluorescence spectra, e) quantified integrated intensity (range, 900–1400 nm), and f) NIR‐II FL images (808 nm excitation, 1064 nm long‐pass filter) and image intensities of NDCPEs at the same concentration. g) NIR‐II FL spectra, h) quantified integrated intensity (range, 900–1400 nm), and i) NIR‐II FL images (808 nm excitation, 1064 nm long‐pass filter) and image intensities of NDCPEs at the same 808 nm optical density. Error bars, mean ± SD.
