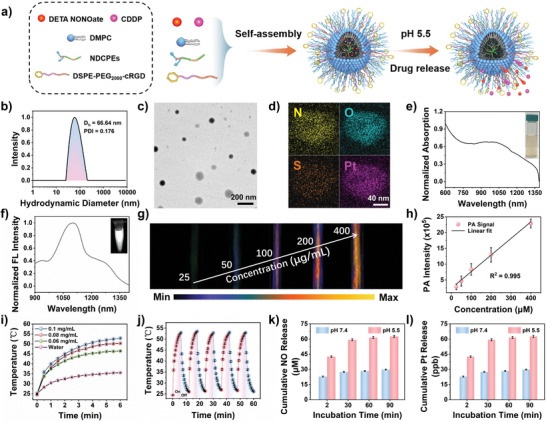
Figure 3.

Characterization of PBT/NO/Pt in aqueous solution. a) Schematic diagram of PBT/NO/Pt self‐assembly in aqueous solution. b) D h of PBT/NO/Pt measured by DLS. c) TEM image of PBT/NO/Pt (scale bar: 200 nm). d) TEM‐EDS element mapping of PBT/NO/Pt (scale bar: 40 nm). e) Normalized absorption spectra of PBT/NO/Pt. Inset: Photograph of PBT/NO/Pt solutions. f) Normalized NIR‐II FL spectra of PBT/NO/Pt. Inset: NIR‐II FL imaging of PBT/NO/Pt. g) In vitro PA images of varying concentrations of PBT/NO/Pt under 1064 nm irradiation. h) Linear relationship between PA signal and PBT/NO/Pt concentration (n = 3). i) Photothermal heating curves of water and PBT/NO/Pt at 0.1, 0.08, and 0.06 mg mL−1 under 1064 nm laser irradiation (1.0 W cm−2) (n = 3). j) Photothermal stability of PBT/NO/Pt over five on–off cycles (n = 3). k) In vitro NO and l) Pt release profiles for PBT/NO/Pt upon different treatments (n = 3). Error bars, mean ± SD (n = 3).
