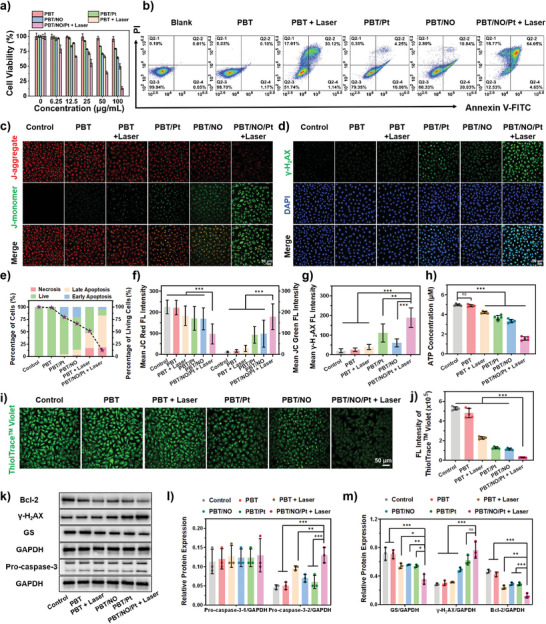
Figure 5.

In vitro evaluation of the anticancer activity and mechanism of PBT/NO/Pt in SKOV3/DDP cells. a) Viability of SKOV3/DDP cells by MTT assay after different treatments (n = 5). b) Cell apoptosis and necrosis were analyzed by flow cytometry with Annexin V‐FITC/PI double staining after different treatments. c) CLSM images of JC‐1 stained SKOV3/DDP cells after different treatments (scale bar: 50 µm). d) γ‐H2AX assays showed the DNA double‐strand break status of SKOV3/DDP cells after different treatments (scale bar: 50 µm). e) Cell death stages were analyzed by flow cytometry and the survival probability of viable cells under different treatment conditions. f) Fluorescence quantitation of JC red and JC green from (c) (analyzed by Image J). g) Fluorescence quantitation of γ‐H2AX from (d) (analyzed by Image J). h) Quantification of adenosine triphosphate (ATP) in SKOV3/DDP cells after different treatments (n = 5). i) CLSM images of ThioTracker Violet stained SKOV3/DDP cells after different treatments (scale bar: 50 µm). j) Quantitative flow cytometry of GSH fluorescence (n = 5). k) Bcl‐2, Pro‐caspase‐3, γ‐H2AX, and GS protein expression in SKOV3/DDP cells. l) Relative expression of Pro‐caspase‐3 (protein/GAPDH, analyzed by Image J, n = 3). m) Relative expression of GS, γ‐H2AX, and Bcl‐2 (protein/GAPDH, analyzed by Image J, n = 3). (The “Control” group is the untreated cells). Data are represented as mean ± standard deviation (SD). (No significance: n.s., * p < 0.05, ** p < 0.01, *** p < 0.001).
