Figure 6.

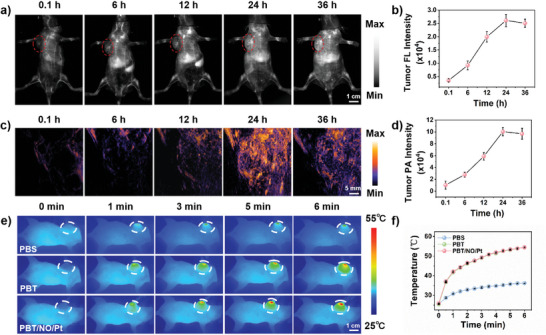
In vivo NIR‐II FL, NIR‐II PA, and photothermal imaging of SKOV3/DDP tumor‐bearing mice. a) NIR‐II FL (Ex: 808 nm, 1064 nm LP filter with 300 ms exposure time, scale bar: 1.0 cm) and c) NIR‐II PA (ex: 1064 nm, scale bar: 5 mm) images of mice upon intravenous injection with PBT/NO/Pt. b) Quantification NIR‐II FL images intensity of tumor sites in (a) (n = 3). d) Quantification NIR‐II PA images intensity of tumor sites in (c) (n = 3). e) Infrared thermal images of mice (scale bar: 1.0 cm) and f) tumor site temperature variation 24 h postinjection with PBT/NO/Pt or PBS upon 1064 nm laser irradiation (1.0 W cm−2) (n = 3). Data represent mean ± standard deviation (SD).
