
Figure 7.
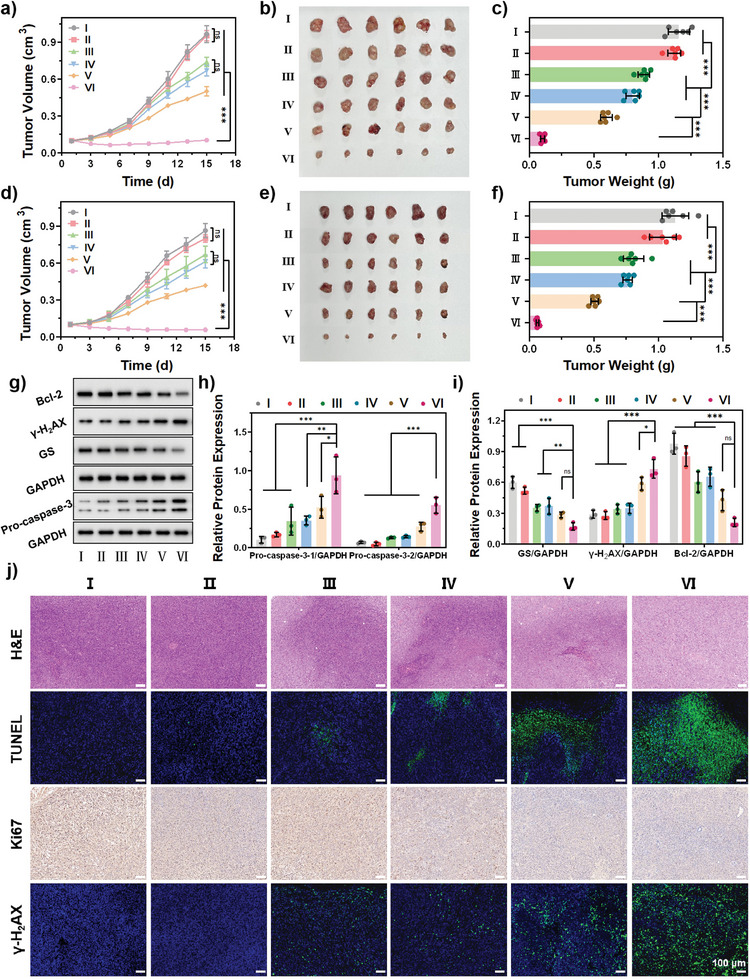
In vivo tumor inhibition against SKOV3 and SKOV3/DDP tumor‐bearing mice. a) Tumor growth curves of SKOV3 xenografted mouse models upon different treatments (n = 6). b) Tumor images of SKOV3 xenografted tumors collected at day 15 after diverse treatments. c) Tumor weight of SKOV3 xenografted mouse after diverse treatments (n = 6). d) Tumor growth curves of SKOV3/DDP xenografted mouse models upon different treatments (n = 6). e) Tumor images of SKOV3/DDP xenografted tumors collected at day 15 after diverse treatments. f) Tumor weight of SKOV3/DDP xenografted mouse after diverse treatments (n = 6). g) Western blot. h) Relative expression of pro‐caspase‐3 (n = 3). i) Relative expression of GS, γ‐H2AX, and Bcl‐2 (n = 3). j) H&E staining, TUNEL staining, and immunohistochemical analysis of Ki67 and γ‐H2AX staining of tumor tissues after different treatments. TUNEL and γ‐H2AX‐positive cells are all stained green. (Scale bar: 100 µm). (I: PBS, II: PBT, III: PBT/Pt, IV: PBT/NO, V: PBT + Laser, VI: PBT/NO/Pt + Laser, (1.0 W cm−2)). Data are represented as mean ± standard deviation (SD). (No significance: n.s., * p < 0.05, ** p < 0.01, *** p < 0.001).