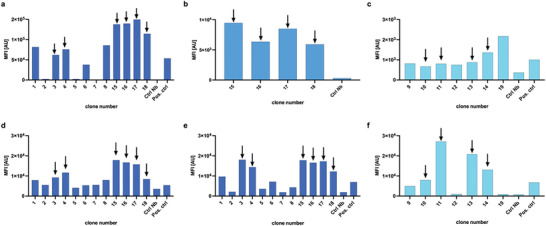
Figure 2.

Mean fluorescent intensity (MFI) values obtained during flow cytometry screening of the selected Nbs on transduced HEK cells (a–c respectively H, C, MuPAR), and d) U87, e) HT29, and f) MC38 cells. Nbs selected for further in vivo evaluation are indicated with arrows.
