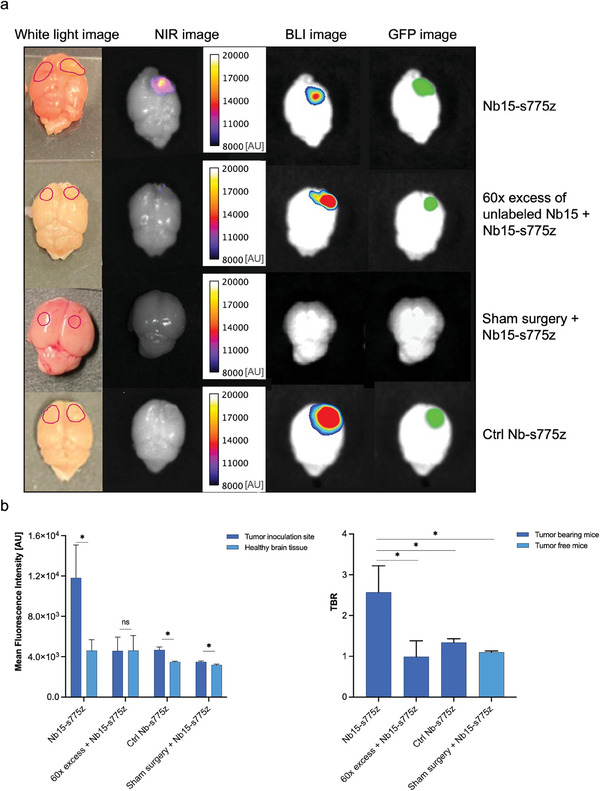
Figure 6.

a) Ex vivo brain imaging 1 h after intravenous injection of fluorescently‐labeled Nbs in U87 orthotopic tumor‐bearing or sham‐operated mice. Regions of interest (ROIs) were drawn based on the GFP image (or injection site for sham surgery) and are indicated on white light images (injection sites and healthy tissues are indicated on the right and left hemispheres, respectively). b) MFIs of tumors and healthy brain tissue and quantified TBRs. Statistical analyses were performed using a Mann‐Whitney test. Healthy brain tissue was used as a control for MFI. TBR values were compared between targeting Nb and control conditions. Statistical significance was set at p < 0.05 (*p < 0.05).
