
Figure 2.
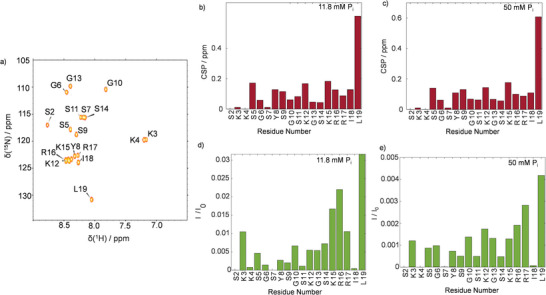
a) 1H‐15N HSQC of R5 with signal assignments as indicated. b,c) CSP upon Pi exposure at concentrations of 11.8 and 50 mm, respectively. d,e) Intensity ratios (I/I 0) between resonances in the presence (I) and absence (I 0) of 11.8 or 50 mm Pi. Residues 2, 4, and 7 remained below the detection threshold in the presence of phosphate. Hence, the respective values are missing.