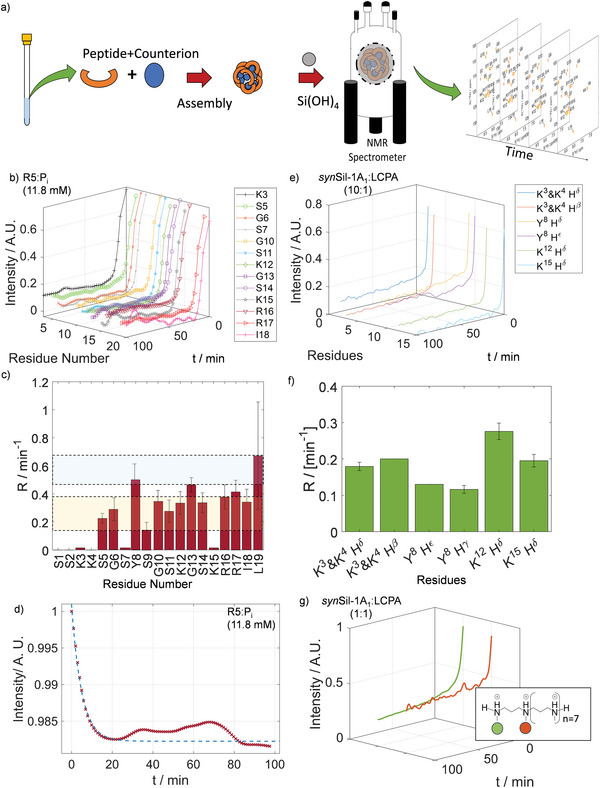
Figure 6.

Real‐time monitoring of silica co‐precipitation. a) Scheme of the process for real‐time precipitation assays, shown exemplarily for synSil‐1A1 and LCPA. b) Time traces of signal intensities for the observable residues of R5 upon the addition of silicic acid. c) Decay rate constants for the residues of panel (b), obtained by fitting the data to exponential functions (see the Figures S22–S26, Supporting Information). The C‐terminal residue show the highest decay rate. The blue and yellow shades indicate faster and slower relaxing residues, respectively. d) Time traces of signal intensity of real‐time monitoring from the phosphate‐ion perspective by 31P NMR e) Time traces of signal intensities for the observable side‐chains of synSil‐1A1 upon addition of silicic acid. f) Signal decay rates for the function in panel (e). g) Time traces of signal intensity of real‐time monitoring from LCPA methyl groups.
