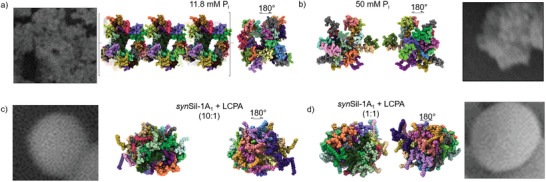
Figure 8.

MD simulations of assemblies. a,b) Snapshot after 1000 µs of supramolecular R5:Pi assembly with 11.8 mm Pi and 50 mm Pi. c,d) Snapshots after 1000 and 1000 µs, respectively, of supramolecular synSil‐1A1:LCPA assembly at 1:1 and 1:10 molar ratios. The EM insets highlight the qualitative match between simulated assemblies and the observed silica morphology. As the experimental and simulated assemblies exist on significantly different length scales, this morphological similarity is indicative of a scale‐free, i.e., fractal spatial organization of the assemblies. Note that R5 and 11.8 mm Pi led to structures that exceeded the simulation box size, as indicated by the square brackets. The different colors in the models indicate different peptide units. For the positioning of the RRIL motifs in panels a) and b), see the Supporting Information.
