Figure 1.

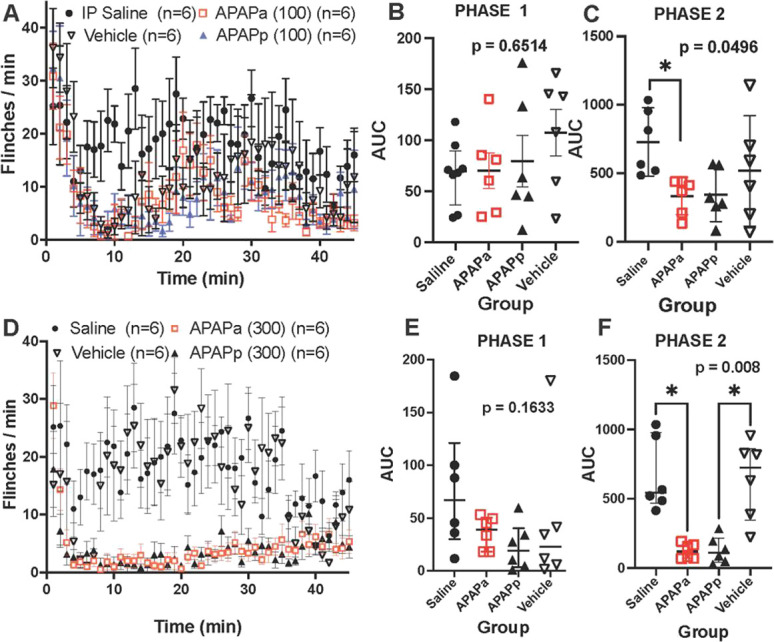
(A, C) Figure presents flinch count (mean ± SEM) for male mice following intraplantar formalin delivered at time 0. Animals received treatment: IP saline, IP vehicle, IP APAPa (ampoule), or IP APAPp (powder) 30 minutes before formalin. (B and E) Scattergram for cumulative flinching count (AUC: median with quartiles) for early phase (phase 1: 0–5 minutes) and (C and F) late phase (phase 2: 6–45 minutes), respectively. (A–C) Data for 100 mg/kg APAP and (D–F) for 300 mg/kg. AUC analysis was performed nonparametrically with Kruskal–Wallis test. Respective P values are presented in the respective scattergrams. Post hoc analysis for significant effects is shown (*P < 0.05). APAP, acetaminophen; AUC, area under the curve; IP, intraperitoneal.
