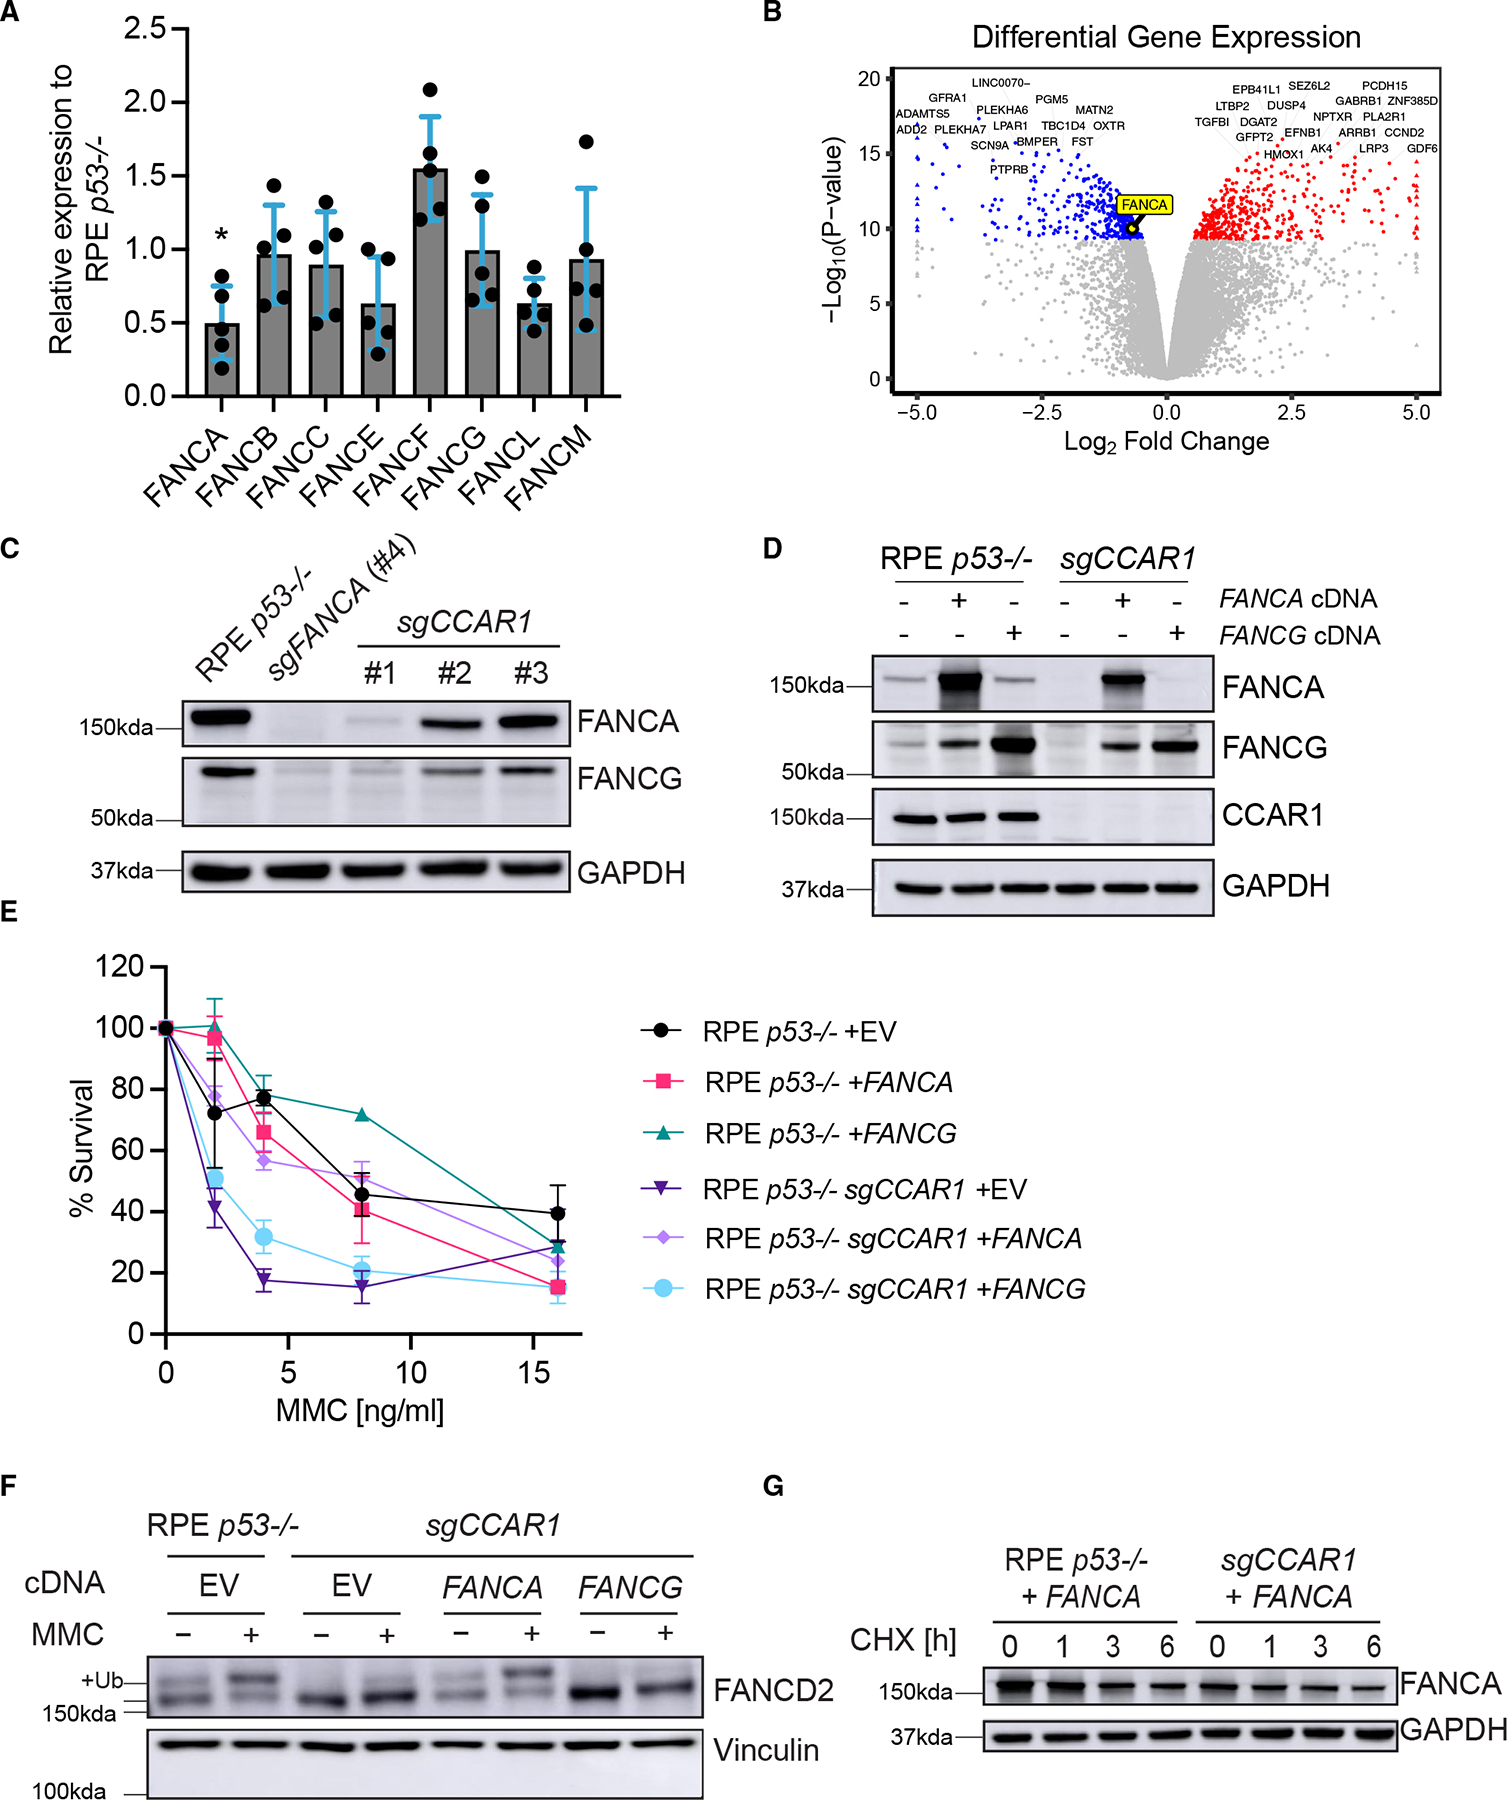
Figure 2. FANCA loss is a key mechanism for the FA phenotypes of CCAR1 knockout cells.

(A) mRNA expression levels of FA core-complex genes in RPE p53−/−CCAR1 knockout clone #1. Mean and SEM from n = 5 independent experiments are plotted. *: p < 0.05 (two-way ANOVA, Šídák’s multiple comparisons test).
(B) Volcano plots showing differential gene expression between control RPE p53−/− and CCAR1 knockout cells.
(C) WB of FANCA and FANCG in RPE p53−/− CCAR1 knockout clones (n = 2).
(D) WB showing complementation of RPE p53−/− and p53−/−CCAR1 knockout cells with FANCA or FANCG cDNA (n = 3).
(E) Colony formation assay data for FANCA or FANCG cDNA transduced RPE p53−/− or p53−/−CCAR1 knockout cells treated with MMC. The cells were treated with MMC for 7 days. Mean and SD from n = 3 independent experiments are plotted.
(F) WB of FANCD2 in RPE p53−/− CCAR1 knockout cells transduced with control (EV), FANCA, or FANCG cDNA. The cells were treated with 100 ng/mL MMC for 24 h (n = 2).
(G) WB of FANCA in RPE p53−/− cells and p53−/−CCAR1 knockout cells transduced with FANCA cDNA. Cells were treated with cycloheximide (CHX) for 1–6 h (n = 3).
See also Figure S2.
