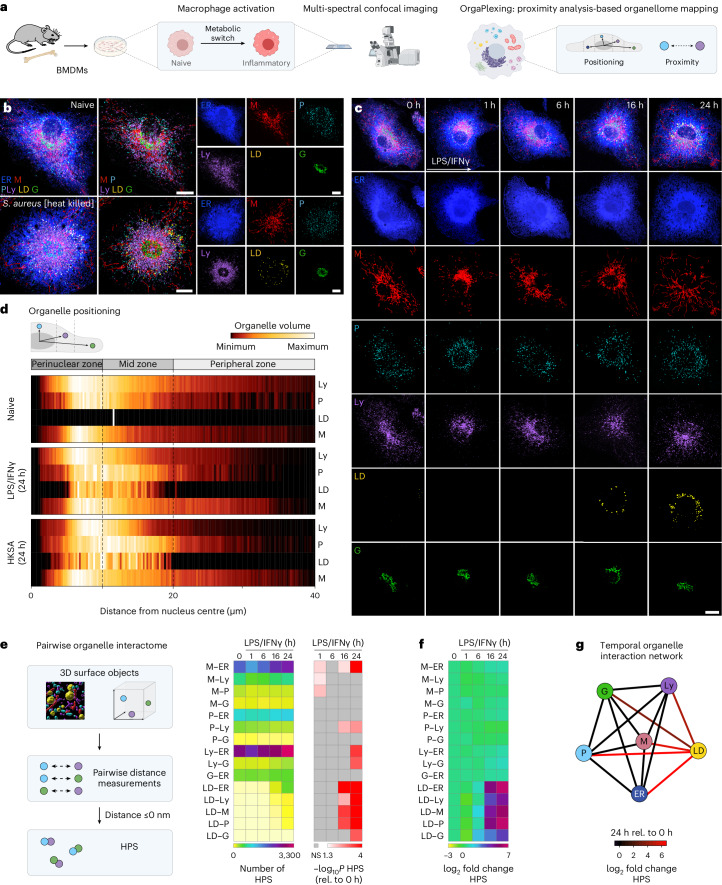
Fig. 1. Inflammatory stimuli rewire the macrophage organellome.
a, Scheme representing the OrgaPlexing work flow. b,c, Immunofluorescence images showing the BMDM organellome upon heat-killed S. aureus (24 h) (b) or LPS/IFNγ (0–24 h) treatment (c). The organelles were visualized using ERmoxVenus (ER, blue), HSP60 (mitochondria (M), red), catalase (peroxisomes (P), cyan), LAMP1 (lysosomes (Ly), purple), Bodipy493/502 (LDs, yellow) and GM130 (Golgi body (G), green). The images are maximum intensity projections and are representative of n = 3 (b,c, 16 h) and n = 4 (c, 0–6 and 24 h) independent experiments. Scale bars, 10 µm. d, Heat maps representing the organelle distribution in BMDMs upon inflammatory activation of N = 15 cells examined over n = 3 independent experiments. The dotted lines indicate borders of perinuclear, mid and peripheral zones. e, Work flow and heat maps showing the number of pairwise organelle HPS upon LPS/IFNγ treatment. Data represent the mean of N = 59 (0 h), N = 48 (1 h), N = 56 (6 h), N = 46 (16 h) and N = 59 (24 h) cells obtained from n = 3 (16 h) and n = 4 (0–6 and 24 h) independent experiments. P values were obtained using one-way analysis of variance (ANOVA) with Tukey’s post hoc test and are depicted as −log10. f, log2-transformed fold change of pairwise organelle proximity sites as described in e. g, Network graph representing the log2-transformed fold change of pairwise organelle proximity sites of LPS/IFNγ-treated (24 h) BMDMs relative (rel.) to naive cells. The numerical P values are indicated in Supplementary Table 4. *P ≤ 0.05, **P ≤ 0.01, ***P ≤ 0.001, ****P ≤ 0.0001. NS, not significant (P > 0.05). Source numerical data are available in Source data.

