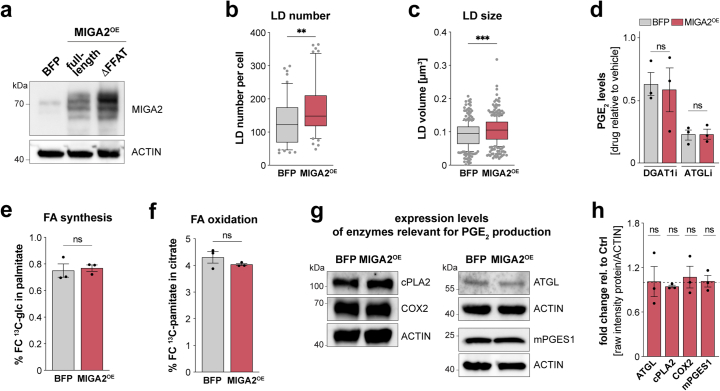
Extended Data Fig. 7. MIGA2 increases LD mass but does not impair mitochondrial fatty acid synthesis or oxidation.
a Western Blot image of MIGA2 and its M-ER tethering-deficient mutant MIGA2DFFAT. Data is representative of n = 2 experimental repeats b,c LD number (b) and volume (c) in BFP or MIGA2 expressing cells. Data represent N = 51;55 (BFP; MIGA2) cells from n = 3 biological repeats. P values were obtained using two-tailed Mann Whitney tests. Boxes represent 25th to 75th percentiles, whiskers 10th and 90th percentiles. Dots are outliers, the median is shown as a line. Data represent N = 46;50 (BFP; MIGA2) cells from n = 3 biological replicates. d PGE2 levels of BFP or MIGA2-expressing LPS/IFN-γ-activated (24 h) BMDMs upon DGAT1i or ATGLi treatment. Data represent n = 3 biological replicates. P values were generated using one-way ANOVA with Sidak’s post-hoc test. e,f Metabolic tracing analysis showing FA synthesis from 13C-glucose (e) and FA oxidation from 13C-palmitate (f) in BMDMs expressing BFP or MIGA2 (LPS/IFN-γ 24 h). Data show n = 3 biological repeats. P values were calculated using two-tailed, unpaired t tests. g,h Representative Western Blot images (g) and quantification (h) showing protein levels of enzymes involved in FA release (ATGL, cPLA2) and PGE2 biogenesis (COX2, mPGES1) in LPS/IFN-γ-activated (24 h) BMDMs upon MIGA2 overexpression. Data represent n = 3 biological replicates. All bars show mean ± SEM (d-f). P values were calculated using two-tailed, one-sample t tests. Numerical P values are available in Supplementary Information Table 4 (*P ≤ 0.05, **P ≤ 0.01, ***P ≤ 0.001, ****P ≤ 0.0001, not significant (ns) P > 0.05). Source numerical data and unprocessed blots are available in source data.

